Tesco plc Annual Report and Accounts 1986 page 47 of 48 previous next
Below is what the machine read from this scan, three times over. They are kept separate rather than merged: where they disagree, the disagreement is itself worth seeing, and a single tidy transcription would hide it.
The left column is raw output. The right is the same text after the repairs that make it searchable — joining letter-spaced words, mending split ones.
Read by machine
    YEAR RECORD
|


    Year ended   February     1977     1978                 1980        1981!         1982            1983     1984                1985  1979    1986
                                £m       £m          £m           £m    £m                  £m          £m           £m              £m     £m

    Turnover net of VAT      701.3    953.0     1,201.8  1,580.6         1,820.7   1,994.4     2,276.6      2,594.5         3,000.4       3,355.3

    Profit before taxation    30.2     28.6        87.7     36.5        35.6          42.7        53.5         67.4            81.3         122.9
    Taxation    (15.2)                  0.5        (1.1)    (1.4)            (5.5)    (12.0)      (11.5)      (24.7)  (30.3)          (47.2)
                                       29.1        36.6     35.1        30.1          30.7        42.0         42.7            51.0    75.7
    Net property profits       0.6      0.2         0.4      0.4        20.0          24.0         7.7          5.2             8.7     8.1
                              15.6     29.3        37.0     35.5        50.1          54.7        49.7         47.9        59.7            83.8
    Extraordinary items        0.3        (0.1)     0.2      0.1                        _—         0.3      (20.0)              —_—    (7.4)
    Dividends                 (4.6)       (5.2)    (6.5)    (8.2)            (8.5)    (10.0)      (11.8)    (13.9)               (16.4)     (23.8)

    Retained                  11.3     24.0        30.7     27.4        41.6          44.7        38.2         14.0        43.3             52.6


                                          p       p        p    p            p            p          p         p        Dp                  p
    Dividends per share                1.46    1.63     1.98     2.45     2.55     3.00           3.50          4.10         4.85           5.80
    Earnings per share:
     Excluding net property profits    4.67    9.06    11.33    10.41     8.90     9.08          12.37     12.47        14.84        19.05
     Including net property profits    4.87    9.12    11.44    10.52    14.79    16.21          14.63     14.00        17.36        21.09
    Fully diluted earnings per
     Excluding net property profits       —       —        —                                     11.89     11.49        13.63        17.52
     Including net property profits               —        —                                     14.02     12.81        15.81        19.29


                                                   %       %    %           %         %           %              %      %                   %
    Profit before taxation to turnover  4.30    3.00    3.13    2.39     1.95         2.14        2.35        2.60   2.71    3.66

    Average number of full-time
    equivalent employees in the
    United Kingdom                    28,413  30,841  35,302    39,862 38,809       40,421      40,377      40,363  42,020   43,447


                                         £        £    £ 7          £        £        £

    Turnover per employee®          24,682   30,900   34,045   38,398   46,913   49,341        56,384       64,279     71,404       77,227
    Wages per employee®              2,289    2,504    2,868    8,478    4,401    4,731         5,227        5,800      6,304        6,907

    Retail price index               174.1    190.6    208.9    248.8    279.8    310.7         327.3        344.0      362.7        381.1

    Number of stores                   722      673      571      552      554        544         489          461        441               395


    7        sq.ft                               sqft          sa.ft                           saft     sq.ft       sq.ft     sa.ft     sq.ft
    Total sales area                  5,196,000  5,400,000 5,650,000 6,210,000  6,840,000 7,203,000 7,425,000 7,362,000   7,415,000 7,502,000
    Average store size (sales area)       7,200     8,000      9,900    11,200   12,300      13,200     15,200   16,000      16,800    19,000

    Average sales area of stores
    opened in the year                   11,266    28,094     22,197    17,676   23,154      22,042     30,569   27,985      36,715    35,597


Notes:
'53 week period.
*Adjusted in respect of the 1985 rights issue.
*Based on full-time equivalent number of employees and turnover exclusive of value added tax.
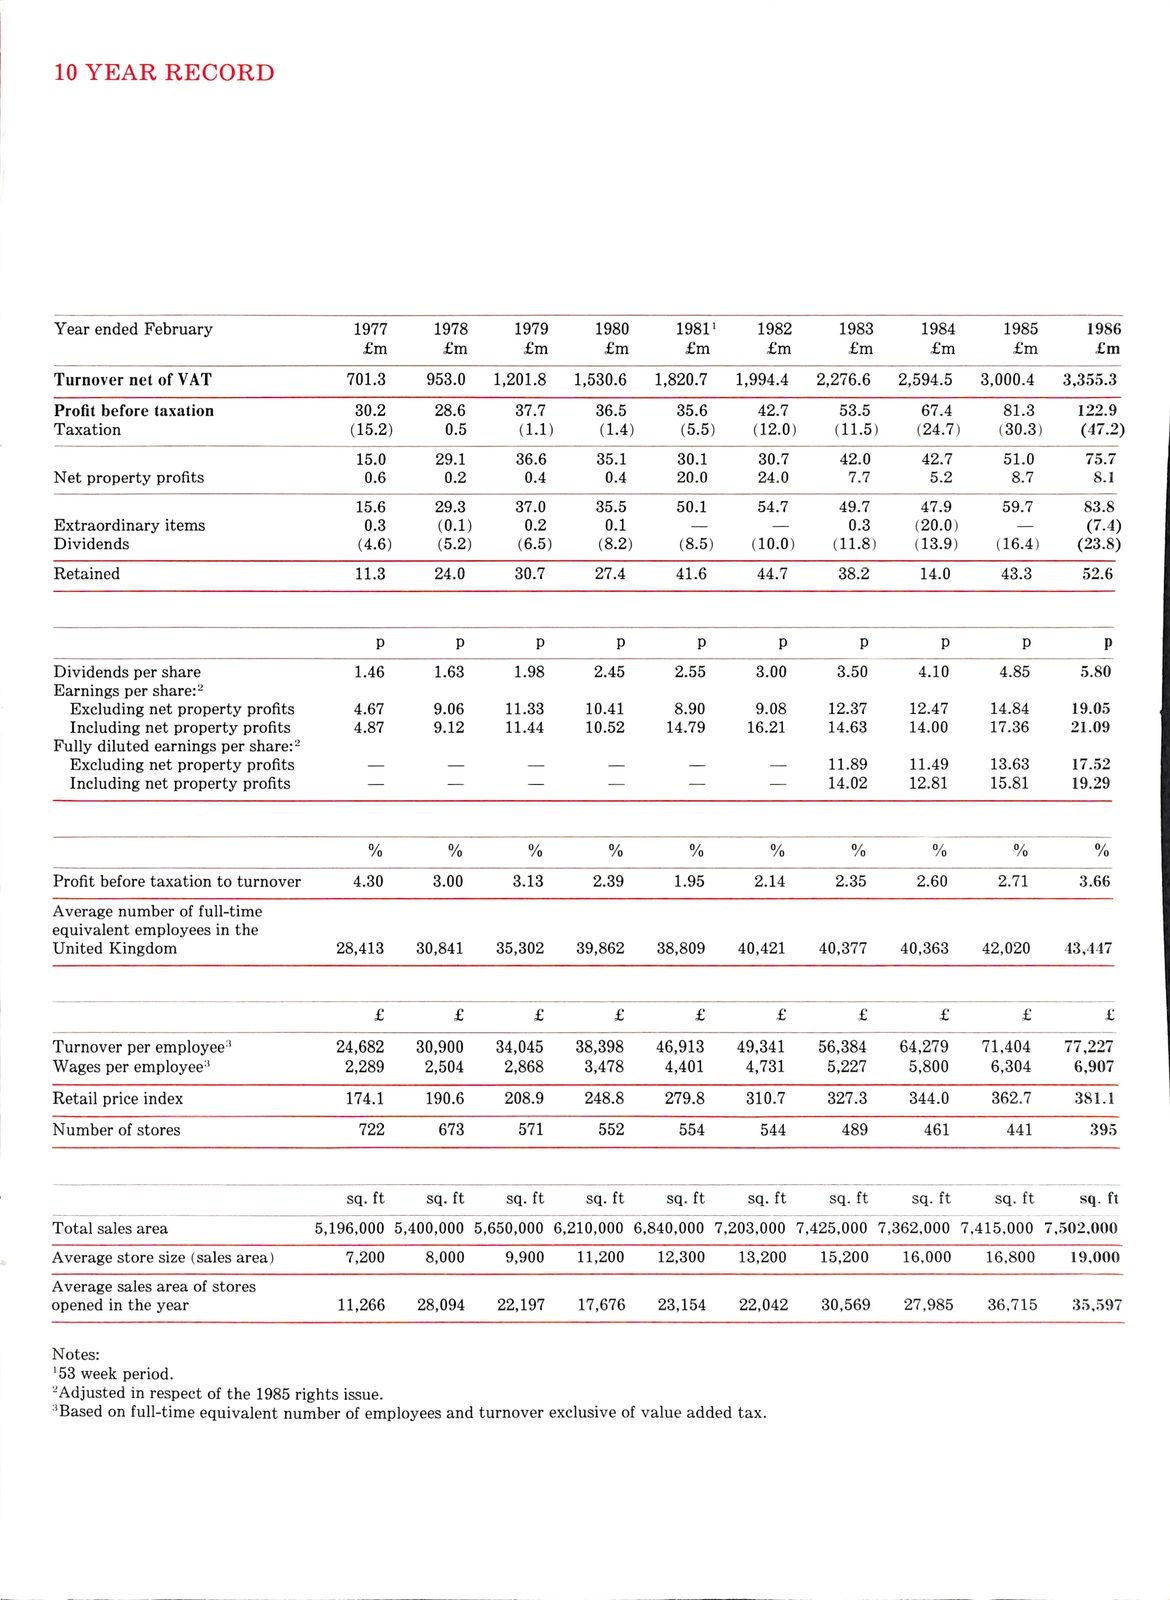
YEAR RECORD | Year ended February19771978 1980 1981! 1982 1983 1984 1985 1979 1986 £m £m £m £m £m £m £m £m £m £m Turnover net of VAT 701.3 953.0 1,201.8 1,580.6 1,820.7 1,994.4 2,276.6 2,594.5 3,000.4 3,355.3 Profit before taxation30.228.6 87.7 36.5 35.6 42.7 53.5 67.4 81.3 122.9 Taxation(15.2)0.5 (1.1) (1.4) (5.5) (12.0) (11.5) (24.7) (30.3) (47.2) 29.1 36.6 35.1 30.1 30.7 42.0 42.7 51.0 75.7 Net property profits0.60.2 0.4 0.4 20.0 24.0 7.7 5.2 8.7 8.1 15.6 29.3 37.0 35.5 50.1 54.7 49.7 47.9 59.7 83.8 Extraordinary items0.3(0.1) 0.2 0.1 _- 0.3 (20.0) -_- (7.4) Dividends(4.6)(5.2) (6.5) (8.2) (8.5) (10.0) (11.8) (13.9) (16.4) (23.8) Retained11.324.0 30.7 27.4 41.6 44.7 38.2 14.0 43.3 52.6 pppppppp Dp p Dividends per share1.461.63 1.98 2.45 2.55 3.00 3.50 4.10 4.85 5.80 Earnings per share: Excluding net property profits4.679.06 11.33 10.41 8.90 9.08 12.37 12.47 14.84 19.05 Including net property profits4.879.12 11.44 10.52 14.79 16.21 14.63 14.00 17.36 21.09 Fully diluted earnings per Excluding net property profits - - - 11.89 11.49 13.63 17.52 Including net property profits - - 14.02 12.81 15.81 19.29 % % % % % % % % % Profit before taxation to turnover4.303.00 3.13 2.39 1.95 2.14 2.35 2.60 2.71 3.66 Average number of full-time equivalent employees in the United Kingdom28,41330,841 35,302 39,862 38,809 40,421 40,377 40,363 42,020 43,447 £££7£££ Turnover per employee®24,68230,900 34,045 38,398 46,913 49,341 56,384 64,279 71,404 77,227 Wages per employee®2,2892,504 2,868 8,478 4,401 4,731 5,227 5,800 6,304 6,907 Retail price index174.1190.6 208.9 248.8 279.8 310.7 327.3 344.0 362.7 381.1 Number of stores722673 571 552 554 544 489 461 441 395 7 sq.ft sqft sa.ft saft sq.ft sq.ft sa.ft sq.ft Total sales area5,196,0005,400,000 5,650,000 6,210,000 6,840,000 7,203,000 7,425,000 7,362,000 7,415,000 7,502,000 Average store size (sales area)7,2008,000 9,900 11,200 12,300 13,200 15,200 16,000 16,800 19,000 Average sales area of stores opened in the year11,26628,094 22,197 17,676 23,154 22,042 30,569 27,985 36,715 35,597 Notes: '53week period. *Adjusted in respect of the 1985rights issue. *Based on full-time equivalent number of employees and turnover exclusive of value added tax.
Read by machine, contrast corrected highest quality of the three
    10 YEAR RECORD
|


    Year ended   February,        1977     1978                 1980        1981!           1982            1983     1984        1985  1979       1986
                                    £m       £m          £m           £m    £m                    £m          £m           £m              £m     £m

    Turnover net of VAT      701.3        953.0     1,201.8  1,580.6         1,820.7     1,994.4     2,276.6      2,594.5         3,000.4      3,355.3

    Profit before taxation    30.2         28.6        37.7     36.5        35.6            42.7        53.5         67.4        81.3             122.9
    Taxation    (15.2)                      0.5        (1.1)    (1.4)              (5.5)    (12.0)      (11.5)      (24.7)  (30.3)          (47.2)
                              15.0         29.1        36.6     35.1        30.1            30.7        42.0         42.7        51.0        75.7
    Net property profits       0.6          0.2         0.4      0.4        20.0            24.0         7.7          Dez             8.7     8.1

                              15.6         29.3        37.0     35.5        50.1            54.7        49.7         47.9        59.7            83.8
    Extraordinary items        0.3            (0.1)     0.2      0.1               —           —         0.3      (20.0)              —_—    (7.4)
    Dividends                 (4.6)           (5.2)    (6.5)    (8.2)              (8.5)    (10.0)      (11.8)    (13.9)               (16.4)     (23.8)

    Retained                  11.3         24.0        30.7     27.4        41.6            44.7        38.2         14.0        43.3             52.6


                                         p       p        p     p           p                  p           p         p           Dp               p
    Dividends per share               1.46    1.63     1.98     2.45     2.55               3.00        3.50          4.10         4.85           5.80
    Earnings per share:
    Excluding net property profits    4.67    9.06    11.33    10.41     8.90     9.08                 12.37     12.47        14.84        19.05
    Including net property profits    4.87    9.12    11.44    10.52    14.79    16.21                 14.63     14.00        17.36        21.09
    Fully diluted earnings per
    Excluding net property profits       —       —        —     —                                      11.89     11.49        13.63        17.52
    Including net property profits               —        —                 —                  —       14.02     12.81        15.81        19.29


                                                   %       %    %           %                  %                       %                          %
    Profit before taxation to turnover  4.30    3.00    3.13    2.39     1.95               2.14        2.35        2.60      2.71                3.66

    Average number of full-time
    equivalent employees in the
    United Kingdom                    28,413  30,841  35,302    39,862 38,809             40,421      40,377      40,363    42,020  43,447


                                       a:        £        £    7      £        £            £               £    _                                ¢
                                                                                                                         7
    Turnover per employee®         24,682   30,900   34,045      38,398   46,913              49,341   56,384     64,279      71,404         77,227
    Wages per employee®             2,289    2,504    2,868       3,478    4,401               4,731    5,227      5,800       6,304          6,907

    Retail price index              174.1    190.6    208.9       248.8    279.8               310.7    327.3      344.0       362.7          381.1

    Number of stores                  722      673      571         552      554            544           489        461         441              395


    7        sq.ft                        sqft              sa.ft    sqft     sqft          saft     sq.ft       sq.ft     sa.ft           sq.ft
    Total sales area                5,196,000 5,400,000 5,650,000 6,210,000  6,840,000 7,203,000 7,425,000 7,362,000   7,415,000       7,502,000
    Average store size (sales area)     7,200     8,000     9,900    11,200   12,300      13,200     15,200   16,000      16,800          19,000

    Average sales area    of stores
    opened in the year                 11,266    28,094    22,197    17,676   23,154      22,042     30,569   27,985      36,715    35,597


Notes:
'53 week period.
*Adjusted in respect of the 1985 rights issue.
*Based on full-time equivalent number of employees and turnover exclusive of value added tax.
10 YEAR RECORD | Year ended February,19771978 1980 1981! 1982 1983 1984 1985 1979 1986 £m £m £m £m £m £m £m £m £m £m Turnover net of VAT 701.3 953.0 1,201.8 1,580.6 1,820.7 1,994.4 2,276.6 2,594.5 3,000.4 3,355.3 Profit before taxation30.228.6 37.7 36.5 35.6 42.7 53.5 67.4 81.3 122.9 Taxation(15.2)0.5 (1.1) (1.4) (5.5) (12.0) (11.5) (24.7) (30.3) (47.2) 15.0 29.1 36.6 35.1 30.1 30.7 42.0 42.7 51.0 75.7 Net property profits0.60.2 0.4 0.4 20.0 24.0 7.7 Dez 8.7 8.1 15.6 29.3 37.0 35.5 50.1 54.7 49.7 47.9 59.7 83.8 Extraordinary items0.3(0.1) 0.2 0.1 - - 0.3 (20.0) -_- (7.4) Dividends(4.6)(5.2) (6.5) (8.2) (8.5) (10.0) (11.8) (13.9) (16.4) (23.8) Retained11.324.0 30.7 27.4 41.6 44.7 38.2 14.0 43.3 52.6 pppppppp Dp p Dividends per share1.461.63 1.98 2.45 2.55 3.00 3.50 4.10 4.85 5.80 Earnings per share: Excluding net property profits4.679.06 11.33 10.41 8.90 9.08 12.37 12.47 14.84 19.05 Including net property profits4.879.12 11.44 10.52 14.79 16.21 14.63 14.00 17.36 21.09 Fully diluted earnings per Excluding net property profits - - - - 11.89 11.49 13.63 17.52 Including net property profits - - - - 14.02 12.81 15.81 19.29 % % % % % % % Profit before taxation to turnover4.303.00 3.13 2.39 1.95 2.14 2.35 2.60 2.71 3.66 Average number of full-time equivalent employees in the United Kingdom28,41330,841 35,302 39,862 38,809 40,421 40,377 40,363 42,020 43,447 a: ££7££££ _ ¢ 7 Turnover per employee®24,68230,900 34,045 38,398 46,913 49,341 56,384 64,279 71,404 77,227 Wages per employee®2,2892,504 2,868 3,478 4,401 4,731 5,227 5,800 6,304 6,907 Retail price index174.1190.6 208.9 248.8 279.8 310.7 327.3 344.0 362.7 381.1 Number of stores722673 571 552 554 544 489 461 441 395 7 sq.ft sqft sa.ft sqft sqft saft sq.ft sq.ft sa.ft sq.ft Total sales area5,196,0005,400,000 5,650,000 6,210,000 6,840,000 7,203,000 7,425,000 7,362,000 7,415,000 7,502,000 Average store size (sales area)7,2008,000 9,900 11,200 12,300 13,200 15,200 16,000 16,800 19,000 Average sales area of stores opened in the year11,26628,094 22,197 17,676 23,154 22,042 30,569 27,985 36,715 35,597 Notes: '53week period. *Adjusted in respect of the 1985rights issue. *Based on full-time equivalent number of employees and turnover exclusive of value added tax.