Tesco plc Annual Report and Accounts 1986 page 24 of 48 previous next
Below is what the machine read from this scan, three times over. They are kept separate rather than merged: where they disagree, the disagreement is itself worth seeing, and a single tidy transcription would hide it.
The left column is raw output. The right is the same text after the repairs that make it searchable — joining letter-spaced words, mending split ones.
Read by machine highest quality of the three
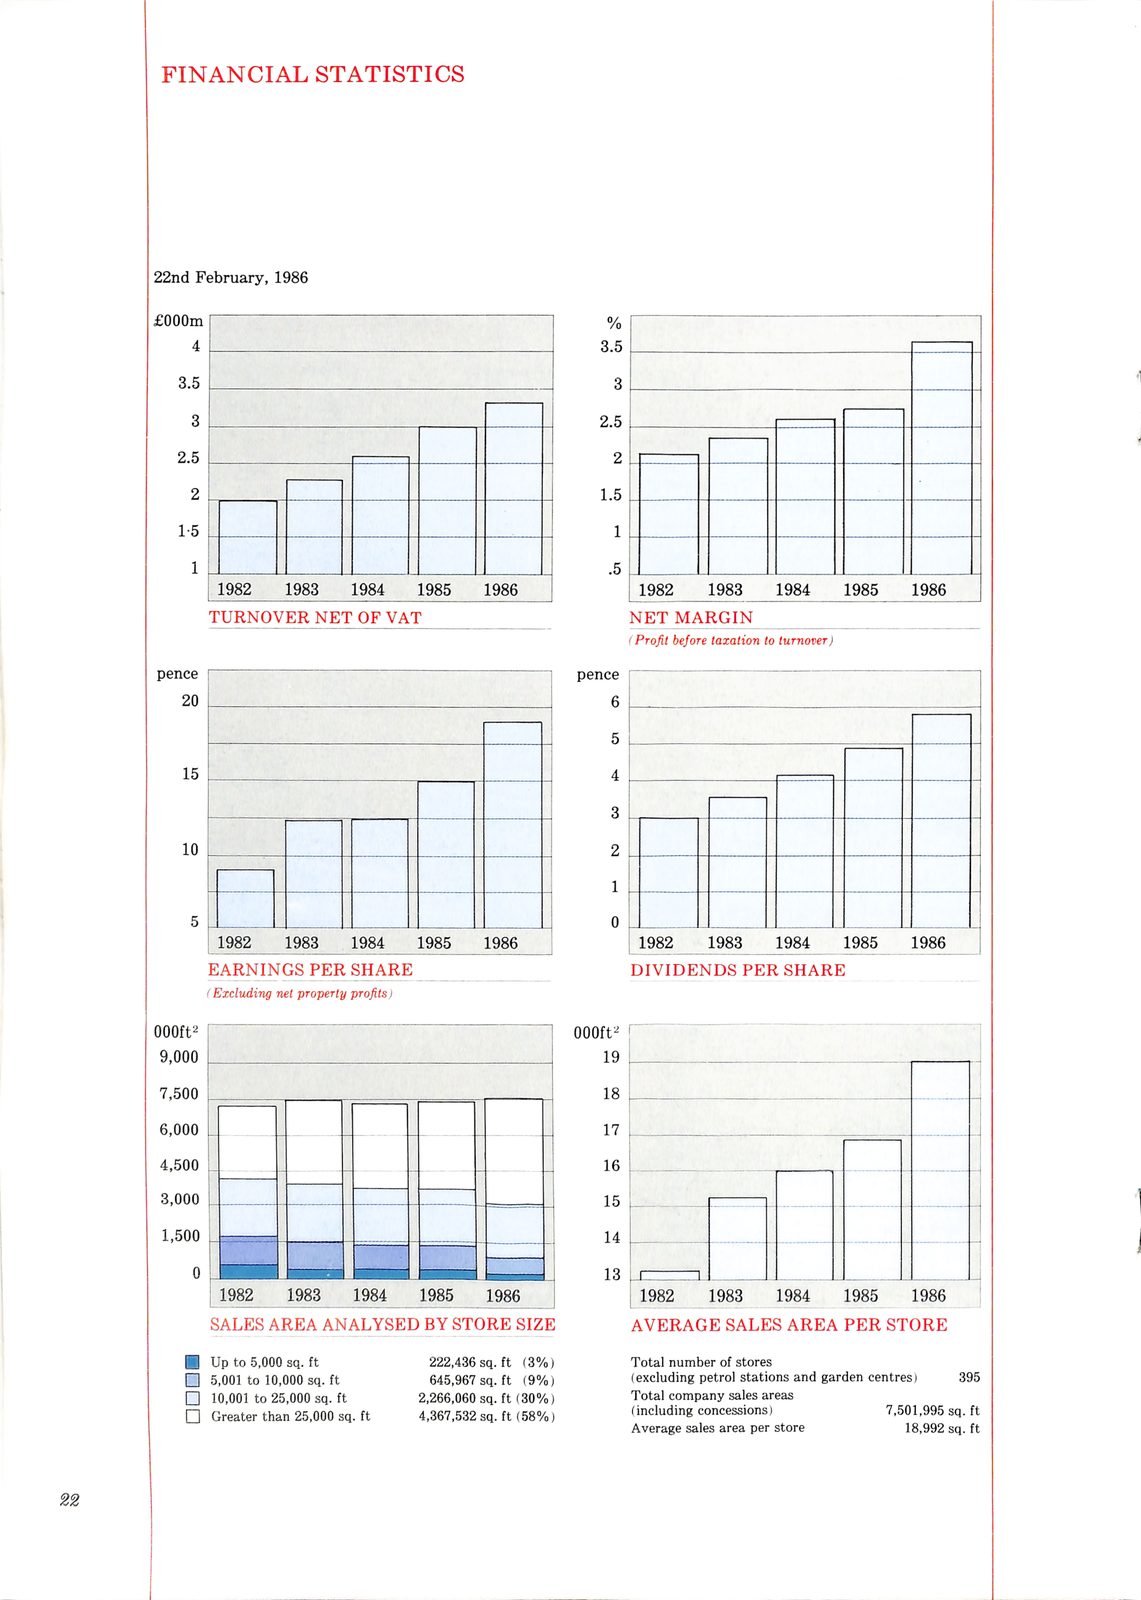
    FINANCIAL STATISTICS


    22nd February, 1986


    £000m        %
    4            3.5

  3.5

    3

  2.5

    2

   15
                                                          |

                 1982  1983  1984  1985  1986              1982   1983  1984  1985  1986
                 NET
             TURNOVER OF VAT
                                                          (Profit before taxation to  )
                                                              turnover

pence        {                                Ee)    pence
   20
                                              eee

                                                              |

   15


    10                                                    |


   Ah
  FIPS                                                                            |
          1982                                                                       1982-1983                                   198419851986
          EARNINGS PER SHARE                                                         DIVIDENDS PER SHARE
                                                )
          (Excluding         net property profits

000ft?
 9,000                                                                        19

 7,500                                                                        18

 6,000       ||                                                               17,        Th                                                 |
                                                                                     RL)

                                                                                  |
 4,500    |                                                                   16.

 3,000       ||                                                               15

    1,500                                                                     14
    o        ;                                                                13  ee     |     |     |        |                        |
             |     1982,                         1986                             _  1982  1983      1984      1985  1986
             SALES                            AREA ANALYSED BY STORE  SIZE           AVERAGE SALES AREA PER STORE

    (Up          to 5,000 sq.  ft                  222,436 sq.  ft    (3%)        Total number of stores
             5,001  to 10,000  sa.   ft            645,967 sq.  ft    (9%)           (excluding petrol stations and garden centres)       395
             10,001 to 25,000  sa.   ft          2,266,060 sq.  ft   (30%)           Total company sales areas
             Greater than 25,000     sq.   ft    4,367,532 sq.  ft   (58%)           (including concessions)        7,501,995          sq. ft
                                                                                     Average sales area per     store  18,992          sq. ft


    22
FINANCIAL STATISTICS
22nd February,1986
£000m %
4 3.5
3.5
3
2.5
2
15
|
1982 1983 1984 1985 1986 1982 1983 1984 1985 1986
NET
TURNOVER OF VAT
(Profit before taxation to )
turnover
pence { Ee) pence
20
eee
|
15
10 |
Ah
FIPS |
1982 1982-1983 198419851986
EARNINGS PER SHARE DIVIDENDS PER SHARE
)
(Excluding net property profits
000ft?
9,000 19
7,500 18
6,000 || 17, Th |
RL)
|
4,500 | 16.
3,000 || 15
1,500 14
o ; 13 ee | | | | |
| 1982, 1986 _ 1982 1983 1984 1985 1986
SALES AREA ANALYSED BY STORE SIZE AVERAGE SALES AREA PER STORE
(Up to 5,000 sq. ft 222,436 sq. ft (3%)Total number of stores
5,001 to 10,000 sa. ft 645,967 sq. ft (9%)(excluding petrol stations and garden centres)395
10,001 to 25,000 sa. ft 2,266,060 sq. ft (30%)Total company sales areas
Greater than25,000 sq. ft 4,367,532 sq. ft (58%)(including concessions)7,501,995 sq. ft
Average sales area per store18,992 sq. ft
22Read by machine, contrast corrected
    FINANCIAL STATISTICS


    22nd February, 1986


    £000m    %
   4        3.5

 3.5        i

   3

 2.5

   2

  15


      1982  1983  1984  1985  1986    1982    1983  1984  1985  1986
                                      NET MARGIN
                                      (Profit before taxation to  )
                                          turnover

pence {        pence
   20


    15                                aol


    10


          |     1982  1983              1984  1985      1986                            19821983     198419851986
          EARNINGS PER SHARE                                                            DIVIDENDS PER SHARE
          (Excluding  net               )
              property profits

000ft?
 9,000                                                                       19    |

 7,500                                                                       18

 6,000    ||                                                                 17             a      =

 4,500    (|                                                                 16                                                                |
 3,000    |                                                                  15    |                                                           |

 1,500                                                                       14

                                                                             13         aaa   |      nat                 |  sachs              |
                                                                                            a                            i
          1982 1988-1984                        1985-1986                               1982  19838      1984      1985      1986
          SALES AREA                              ANALYSED BY STORE  SIZE               AVERAGE SALES AREA PER STORE

     |    Up to 5,000   sq.  ft                   222,436 sq.  ft    (3%)          Total number of stores
          5,001  to  10,000  sq.   ft             645,967 sq.  ft    (9%)               (excluding petrol stations and garden centres)       395
          10,001     to 25,000 sa.  ft          2,266,060 sq.  ft   (30%)               Total company sales areas
          Greater than 25,000       sq.   ft    4,367,532 sq.  ft   (58%)               (including concessions)        7,501,995          sq. ft
                                                                                        Average sales area per     store      18,992      sq. ft


    22
FINANCIAL STATISTICS
22nd February,1986
£000m %
4 3.5
3.5 i
3
2.5
2
15
1982 1983 1984 1985 1986 1982 1983 1984 1985 1986
NET MARGIN
(Profit before taxation to )
turnover
pence { pence
20
15 aol
10
| 1982 1983 1984 1985 1986 19821983 198419851986
EARNINGS PER SHARE DIVIDENDS PER SHARE
(Excluding net )
property profits
000ft?
9,000 19 |
7,500 18
6,000 || 17 a =
4,500 (| 16 |
3,000 | 15 | |
1,500 14
13 aaa | nat | sachs |
a i
1982 1988-1984 1985-1986 1982 19838 1984 1985 1986
SALES AREA ANALYSED BY STORE SIZE AVERAGE SALES AREA PER STORE
| Up to 5,000 sq. ft 222,436 sq. ft (3%)Total number of stores
5,001 to 10,000 sq. ft 645,967 sq. ft (9%)(excluding petrol stations and garden centres)395
10,001 to 25,000 sa. ft 2,266,060 sq. ft (30%)Total company sales areas
Greater than25,000 sq. ft 4,367,532 sq. ft (58%)(including concessions)7,501,995 sq. ft
Average sales area per store18,992 sq. ft
22