Below is what the machine read from this scan, three times over. They are kept separate rather than merged: where they disagree, the disagreement is itself worth seeing, and a single tidy transcription would hide it.
The left column is raw output. The right is the same text after the repairs that make it searchable — joining letter-spaced words, mending split ones.
Text already in the scan
    6. I n t e r i m r e s u l t s
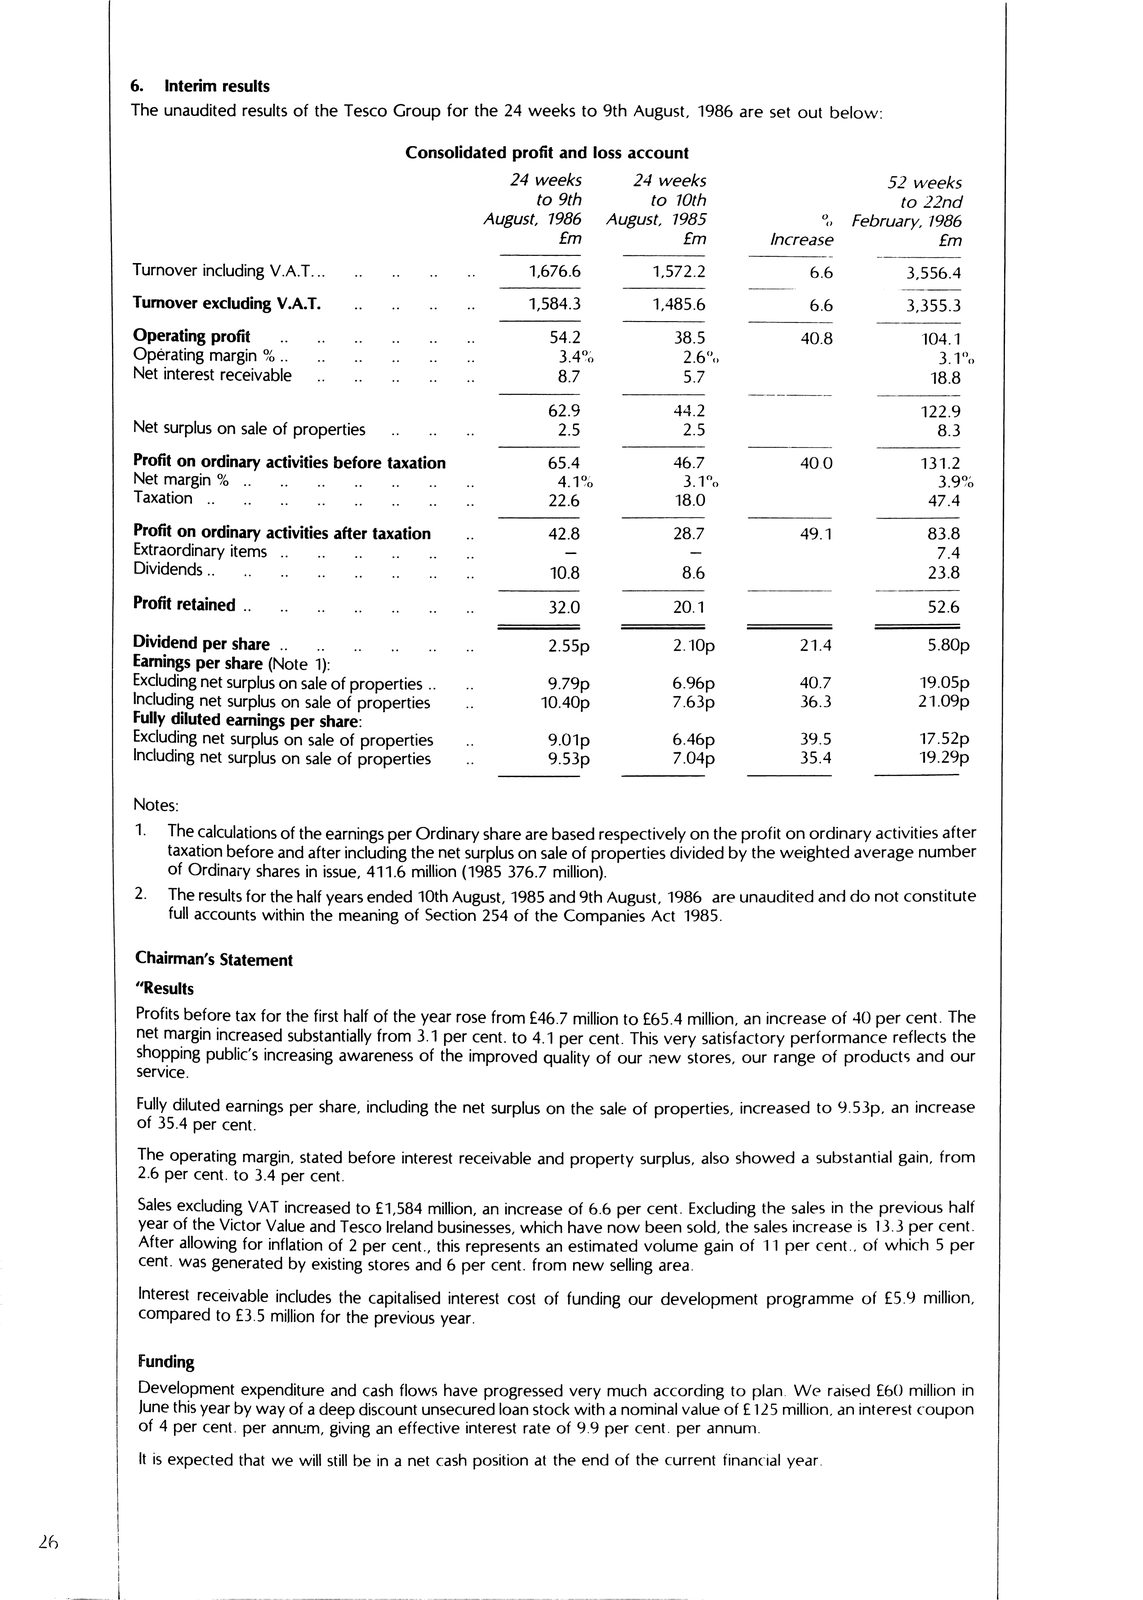
    The unaudited results of the Tesco Group for the 24 weeks to 9th August, 1986 are set out below;

              Consolidated                          profit      and  loss  account
                                                    24        weeks        24  weeks                         5 2          w e e k s
                                                       to       9th           t o   1 0 t h                  t o            2 2 n d
              August,                                      1986        August,      1985                 oo      February,     1986
                                                                 £m                         £m    I n c r e a s e                £m
    Turnover including V.A.T                                1,676.6                 1,5 7 2 .2    6 .6                      3,556.4
    Turnover excluding V.A.T                                1,584.3                    1,485.6    6 .6       3,355               .3
    Operating profit                                       5 4 .2                   3 8 .5        4 0 .8                     1 04.1
    Operating margin %                                     3 .4%                   2 .6%                                      3 .1%
    Net   interest   receivable                                8 .7                       5 .7                               1 8 .8

                                                           6 2 .9                   4 4 .2                                 1 2 2 .9
    Net surplus on sale of properties                          2 .5                       2 .5                                 8 .3
    Profit on ordinary activities before taxation          6 5 .4                   4 6 .7        4 0 0                    1 3 1 .2
    Net margin %                                           4 .1%                   3 .1%                                      3 .9%
    Taxation                                               2 2 .6                   1 8 .0                                   4 7 .4
    Profit on ordinary activities after taxation           4 2 .8                   2 8 .7        4 9 .1                     8 3 .8
    Extraordinary items                                                                                                        7 .4
    Dividends                                              1 0 .8                          8,6                               2 3 .8

    Profit retained                                        3 2 .0                   2 0 .1                                   5 2 .6

    Dividend per share                                     2.55p                    2.10p         2 1 .4                   5.80p
    Earnings per share (Note 1):
    Excluding net surplus on sale of properties ..         9.79p                    6.96p         4 0    .7                19.05p
    Including net surplus on sale of properties            10.40p                   7.63p         3 6    .3                21.09p
    Fully diluted earnings per share:
    Excluding net surplus on sale of properties            9.01p                    6.46p         3 9    .5                17.52p
    Including net surplus on sale of properties            9.53p                    7.04p         3 5 .4                   19.29p

    Notes:
    1. The calculations of the earnings per Ordinary share are based respectively on the profit on ordinary activities after
                   taxation before and after including the net surplus on sale of properties divided by the weighted average number
          of Ordinary shares in issue, 411.6 million (1985 376.7 million).
    2. The results for the half years ended 10th August, 1985 and 9th August, 1986 are unaudited and do not constitute
          full accounts within the meaning of Section 254 of the Companies Act 1985.

    Chairman's     Statement
    "Results
    Profits before tax for the first half of the year rose from £46.7 million to £65.4 million, an increase of 40 per cent. The
    net margin increased substantially from 3.1 per cent, to 4.1 per cent. This very satisfactory performance reflects the
    shopping public's increasing awareness of the improved quality of our new stores, our range of products and our
    se rv ice .

    Fully diluted earnings per share, including the net surplus on the sale of properties, increased to 9.53p, an increase
    of 35.4 per cent.
    The operating margin, stated before interest receivable and property surplus, also showed a substantial gain, from
    2.6 per cent, to 3.4 per cent.
    Sales excluding VAT increased to £1,584 million, an increase of 6.6 per cent. Excluding the sales in the previous half
 year of the Victor Value and Tesco Ireland businesses, which have now been sold, the sales increase is 13.3 per cent.
 After allowing for inflation of 2 per cent., this represents an estimated volume gain of 11 per cent., of which 5 per
    cent, was generated by existing stores and 6 per cent, from new selling area.
   Interest receivable includes the capitalised interest cost of funding our development programme of £5.9 million,
    compared to £3.5 million for the previous year.

    Funding
      Development expenditure and cash flows have progressed very much according to plan We raised £60 million in
)une this year by way of a deep discount unsecured loan stock with a nominal value of £ 125 million, an interest coupon
    of 4 per cent, per annum, giving an effective interest rate of 9.9 per cent, per annum.
    It is  expected that we will still be in a net cash position at the end of the current financial year


    2 6
6. Interimresults The unaudited results of the Tesco Group for the 24 weeks to 9th August,1986 are set out below; Consolidated profit and loss account 24 weeks 24 weeks 52weeks to 9th to10thto22nd August,1986 August,1985 oo February,1986 £m £m Increase £m Turnover including V.A.T 1,676.6 1,5 7 2 .2 6 .6 3,556.4 Turnover excluding V.A.T 1,584.3 1,485.6 6 .6 3,355 .3 Operating profit 5 4 .2 3 8 .5 4 0 .8 1 04.1 Operating margin % 3 .4% 2 .6% 3 .1% Net interest receivable 8 .7 5 .7 1 8 .8 6 2 .9 4 4 .2 122 .9 Net surplus on sale of properties 2 .5 2 .5 8 .3 Profit on ordinary activities before taxation 6 5 .4 4 6 .7 400131 .2 Net margin % 4 .1% 3 .1% 3 .9% Taxation 2 2 .6 1 8 .0 4 7 .4 Profit on ordinary activities after taxation 4 2 .8 2 8 .7 4 9 .1 8 3 .8 Extraordinary items 7 .4 Dividends 1 0 .8 8,6 2 3 .8 Profit retained 3 2 .0 2 0 .1 5 2 .6 Dividend per share 2.55p 2.10p 2 1 .4 5.80p Earnings per share (Note1): Excluding net surplus on sale of properties .. 9.79p 6.96p 4 0 .7 19.05p Including net surplus on sale of properties 10.40p 7.63p 3 6 .3 21.09p Fully diluted earnings per share: Excluding net surplus on sale of properties 9.01p 6.46p 3 9 .5 17.52p Including net surplus on sale of properties 9.53p 7.04p 3 5 .4 19.29p Notes: 1. The calculations of the earnings per Ordinary share are based respectively on the profit on ordinary activities after taxation before and after including the net surplus on sale of properties divided by the weighted average number of Ordinary shares in issue,411.6 million(1985376.7 million). 2. The results for the half years ended 10th August,1985 and 9th August,1986 are unaudited and do not constitute full accounts within the meaning of Section254 of the Companies Act 1985. Chairman's Statement "Results Profits before tax for the first half of the year rose from£46.7 million to £65.4million, an increase of 40 per cent. The net margin increased substantially from3.1 per cent, to 4.1percent. This very satisfactory performance reflects the shopping public's increasing awareness of the improved quality of our new stores, our range of products and our se rv ice . Fully diluted earnings per share, including the net surplus on the sale of properties, increased to 9.53p, an increase of 35.4percent. The operating margin, stated before interest receivable and property surplus, also showed a substantial gain, from 2.6percent, to 3.4percent. Sales excluding VAT increased to £1,584million, an increase of 6.6percent. Excluding the sales in the previous half year of the Victor Value and Tesco Ireland businesses, which have now been sold, the sales increase is 13.3percent. After allowing for inflation of 2 per cent., this represents an estimated volume gain of 11 per cent., of which 5 per cent, was generated by existing stores and 6 per cent, from new selling area. Interest receivable includes the capitalised interest cost of funding our development programme of £5.9million, compared to £3.5million for the previous year. Funding Development expenditure and cash flows have progressed very much according to plan We raised£60 million in )une this year by way of a deep discount unsecured loan stock with a nominal value of £125million, an interest coupon of 4 per cent, per annum, giving an effective interest rate of 9.9percent, per annum. It is expected that we will still be in a net cash position at the end of the current financial year 2 6
Read by machine highest quality of the three
6. Interim results
The unaudited results of the Tesco Group for the 24 weeks to 9th August, 1986 are set out below:

                                                   Consolidated profit and loss            account

                                                                          24 weeks                  24 weeks                              2 weeks
   to                                                                          9th              to  10th                                 to  22nd
                                                     August,                1986     August,        1985                    %      February, 1986
                                                                               £m                         £m       Increase                    £m

    Turnover including V.A.T...     0.600.           0                     1,676.6                   1,572.2              6.6             3,556.4
    Turnover excluding V.A.T.                                              1,584.3                   1,485.6              6.6             3,355.3
    Operating profit,          2.     wa                                    54.2                    38.5                 40.8               104.1
                     margin%..                                                    3.4%                                                          3.1%  2.6%
    Net interest    receivable     .                                           8.7                       5.7                                 18.8

                                                                            62.9                    44.2                                    122.9
    Net surplus   on   sale of     properties                                  2.5                       2.5                                  8.3
    Profit on   ordinary activities before taxation                         65.4                    46.7                 40.0               131.2
    Net margin    %  ..        .                 a     .                          4.1%                                                          3.9%  3.1%
    Taxation                                                                22.6                        18.0                                 47.4

    Profit on   ordinary activities     after taxation                      42.8                    28.7                 49.1                83.8
    Extraordinary    items     ..                                              -                      -                                       7.4
    Dividends.                                                                10.8                       8.6                                 23.8
    Profitretaned..                                                         32.0                    20.1                                     52.6

    Dividend        pershare..                                              2.55p                   2.10p                21.4               5.80p
    Earnings    per share (Note     1):
    Excluding   net surplus    on    sale of properties...                  9.79p                   6.96p                40.7               19.05p
    Including   net surplus    on    sale of properties                       10.40p                7.63p                36.3               21.09p
    Fully diluted   earnings       per share:
    Excluding     net surplus  on    sale of properties                     9.01p                   6.46p                39.5               17.52p
    Including     net surplus  on    sale of properties                     9.53p                   7.04p                35.4               19.29p

Notes:
 1. The calculations of the earnings per Ordinary share are based respectively on the profit on ordinary activities after
     taxation before and after including the net surplus on sale of properties divided by the weighted average number
     of Ordinary shares in issue, 411.6 million 1985 376.7 million).
 2. The results for the half years ended 10th August, 1985 and 9th August, 1986 are unaudited and do not constitute
     full accounts within the meaning of Section 254 of the Companies Act 1985.

    Chairman’s     Statement

    “Results
    Profits before   tax for the first    half of the   year rose    from £46.7 million    to  £65.4 million,   an increase of 40    per  cent.  The
    net margin increased substantially from          3.1     per cent. to 4.1  per  cent.  This  very     satisfactory      performance reflects the
    shopping    public’s    increasing    awareness     of   the improved   quality     of our new    stores,   our range  of     products and   our
    service.

    Fully  diluted  earnings       per share,    including the net surplus  on  the sale of     properties,     increased  to  9.53p,  an   increase
    of 35.4     per cent.
    The   operating margin, stated     before interest     receivable and       property     surplus,     also  showed  a  substantial gain,    from
    2.6 per cent.    to  3.4   per cent.
    Sales excluding     VAT increased     to     £1,584 million, an increase of     6.6    per  cent. Excluding the sales      in  the previous half
    year   of the Victor    Value and Tesco Ireland businesses,     which have          now     been sold, the sales increase is     13.3 per  cent.
    After allowing   for inflation     of 2   per cent.,    this represents an       estimated  volume     gain of 11 per  cent., of  which 5    per
    cent.  was  generated by       existing      stores and 6    per cent. from new     selling  area.
    Interest    receivable    includes    the    capitalised interest cost  of  funding    our   development     programme        of  £5.9  million,
    compared     to  £3.5 million     for the    previous    year.

    Funding
    Development     expenditure and cash flows have progressed                  very    much according     to   plan.  We  raised    £60 million  in
    June this   year by  way       of a deep discount unsecured loan stock with         a  nominal value of £125 million,      an    interest coupon
 of 4 per cent. per annum, giving an effective interest rate of 9.9 per cent. per annum.
 It is expected that we will still be in a net cash position at the end of the current financial year.


    26
6. Interim results The unaudited results of the Tesco Group for the 24 weeks to 9th August,1986 are set out below: Consolidated profit and loss account 24 weeks 24 weeks 2 weeks to 9th to 10th to 22nd August,1986 August,1985% February,1986 £m £m Increase £m Turnover including V.A.T... 0.600. 0 1,676.6 1,572.2 6.6 3,556.4 Turnover excluding V.A.T. 1,584.3 1,485.6 6.6 3,355.3 Operating profit, 2. wa 54.2 38.5 40.8 104.1 margin%..3.4%3.1% 2.6% Net interest receivable.8.7 5.7 18.8 62.9 44.2 122.9 Net surplus on sale of properties2.52.5 8.3 Profit on ordinary activities before taxation65.446.7 40.0 131.2 Net margin % .. . a . 4.1% 3.9% 3.1% Taxation22.618.0 47.4 Profit on ordinary activities after taxation42.828.7 49.1 83.8 Extraordinary items .. - - 7.4 Dividends.10.88.6 23.8 Profitretaned.. 32.0 20.1 52.6 Dividend pershare.. 2.55p 2.10p 21.4 5.80p Earnings per share (Note1): Excluding net surplus on sale of properties... 9.79p 6.96p 40.7 19.05p Including net surplus on sale of properties 10.40p 7.63p 36.3 21.09p Fully diluted earnings per share: Excluding net surplus on sale of properties 9.01p 6.46p 39.5 17.52p Including net surplus on sale of properties 9.53p 7.04p 35.4 19.29p Notes: 1. The calculations of the earnings per Ordinary share are based respectively on the profit on ordinary activities after taxation before and after including the net surplus on sale of properties divided by the weighted average number of Ordinary shares in issue,411.6 million1985376.7 million). 2. The results for the half years ended 10th August,1985 and 9th August,1986 are unaudited and do not constitute full accounts within the meaning of Section254 of the Companies Act 1985. Chairman's Statement "Results Profits before tax for the first half of the year rose from£46.7 million to £65.4million, an increase of 40 per cent. The net margin increased substantially from3.1 per cent. to 4.1percent. This very satisfactory performance reflects the shopping public's increasing awareness of the improved quality of our new stores, our range of products and our service. Fully diluted earnings per share, including the net surplus on the sale of properties, increased to 9.53p, an increase of 35.4percent. The operating margin, stated before interest receivable and property surplus, also showed a substantial gain, from 2.6percent. to 3.4percent. Sales excluding VAT increased to £1,584million, an increase of 6.6percent. Excluding the sales in the previous half year of the Victor Value and Tesco Ireland businesses, which have now been sold, the sales increase is 13.3percent. After allowing for inflation of 2 per cent., this represents an estimated volume gain of 11 per cent., of which 5 per cent. was generated by existing stores and 6 per cent. from new selling area. Interest receivable includes the capitalised interest cost of funding our development programme of £5.9million, compared to £3.5million for the previous year. Funding Development expenditure and cash flows have progressed very much according to plan. We raised£60 million in June this year by way of a deep discount unsecured loan stock with a nominal value of £125million, an interest coupon of 4 per cent. per annum, giving an effective interest rate of 9.9percent. per annum. It is expected that we will still be in a net cash position at the end of the current financial year. 26
Read by machine, contrast corrected
6. Interim results
The unaudited results of the Tesco Group for the 24 weeks to 9th August, 1986 are set out below:

                                                   Consolidated profit and loss            account

                                                                          24 weeks                  24 weeks                              2 weeks
   to                                                                          9th              to  10th                                 to  22nd
                                                     August,                1986     August,        1985                    %      February, 1986
                                                                               £m                         £m       Increase                    £m

    Turnover including V.A.T...     0.600.           0                     1,676.6                   1,572.2              6.6             3,556.4
    Turnover excluding V.A.T.                                              1,584.3                   1,485.6              6.6             3,355.3
    Operating profit,          2.     wa                                    54.2                    38.5                 40.8               104.1
                     margin%..                                                    3.4%                                                          3.1%  2.6%
    Net interest    receivable     .                                           8.7                       5.7                                 18.8

                                                                            62.9                    44.2                                    122.9
    Net surplus   on   sale of     properties                                  2.5                       2.5                                  8.3
    Profit on   ordinary activities before taxation                         65.4                    46.7                 40.0               131.2
    Net margin    %  ..        .                 a     .                          4.1%                                                          3.9%  3.1%
    Taxation                                                                22.6                        18.0                                 47.4

    Profit on   ordinary activities     after taxation                      42.8                    28.7                 49.1                83.8
    Extraordinary    items     ..                                              -                      -                                       7.4
    Dividends.                                                                10.8                       8.6                                 23.8
    Profitretaned..                                                         32.0                    20.1                                     52.6

    Dividend        pershare..                                              2.55p                   2.10p                21.4               5.80p
    Earnings    per share (Note     1):
    Excluding   net surplus    on    sale of properties...                  9.79p                   6.96p                40.7               19.05p
    Including   net surplus    on    sale of properties                       10.40p                7.63p                36.3               21.09p
    Fully diluted   earnings       per share:
    Excluding     net surplus  on    sale of properties                     9.01p                   6.46p                39.5               17.52p
    Including     net surplus  on    sale of properties                     9.53p                   7.04p                35.4               19.29p

Notes:
 1. The calculations of the earnings per Ordinary share are based respectively on the profit on ordinary activities after
     taxation before and after including the net surplus on sale of properties divided by the weighted average number
     of Ordinary shares in issue, 411.6 million 1985 376.7 million).
 2. The results for the half years ended 10th August, 1985 and 9th August, 1986 are unaudited and do not constitute
     full accounts within the meaning of Section 254 of the Companies Act 1985.

    Chairman’s     Statement

    “Results
    Profits before   tax for the first    half of the   year rose    from £46.7 million    to  £65.4 million,   an increase of 40    per  cent.  The
    net margin increased substantially from          3.1     per cent. to 4.1  per  cent.  This  very     satisfactory      performance reflects the
    shopping    public’s    increasing    awareness     of   the improved   quality     of our new    stores,   our range  of     products and   our
    service.

    Fully  diluted  earnings       per share,    including the net surplus  on  the sale of     properties,     increased  to  9.53p,  an   increase
    of 35.4     per cent.
    The   operating margin, stated     before interest     receivable and       property     surplus,     also  showed  a  substantial gain,    from
    2.6 per cent.    to  3.4   per cent.
    Sales excluding     VAT increased     to     £1,584 million, an increase of     6.6    per  cent. Excluding the sales      in  the previous half
    year   of the Victor    Value and Tesco Ireland businesses,     which have          now     been sold, the sales increase is     13.3 per  cent.
    After allowing   for inflation     of 2   per cent.,    this represents an       estimated  volume     gain of 11 per  cent., of  which 5    per
    cent.  was  generated by       existing      stores and 6    per cent. from new     selling  area.
    Interest    receivable    includes    the    capitalised interest cost  of  funding    our   development     programme        of  £5.9  million,
    compared     to  £3.5 million     for the    previous    year.

    Funding
    Development     expenditure and cash flows have progressed                  very    much according     to   plan.  We  raised    £60 million  in
    June this   year by  way       of a deep discount unsecured loan stock with         a  nominal value of £125 million,      an    interest coupon
 of 4 per cent. per annum, giving an effective interest rate of 9.9 per cent. per annum.
 It is expected that we will still be in a net cash position at the end of the current financial year.


    26
6. Interim results The unaudited results of the Tesco Group for the 24 weeks to 9th August,1986 are set out below: Consolidated profit and loss account 24 weeks 24 weeks 2 weeks to 9th to 10th to 22nd August,1986 August,1985% February,1986 £m £m Increase £m Turnover including V.A.T... 0.600. 0 1,676.6 1,572.2 6.6 3,556.4 Turnover excluding V.A.T. 1,584.3 1,485.6 6.6 3,355.3 Operating profit, 2. wa 54.2 38.5 40.8 104.1 margin%..3.4%3.1% 2.6% Net interest receivable.8.7 5.7 18.8 62.9 44.2 122.9 Net surplus on sale of properties2.52.5 8.3 Profit on ordinary activities before taxation65.446.7 40.0 131.2 Net margin % .. . a . 4.1% 3.9% 3.1% Taxation22.618.0 47.4 Profit on ordinary activities after taxation42.828.7 49.1 83.8 Extraordinary items .. - - 7.4 Dividends.10.88.6 23.8 Profitretaned.. 32.0 20.1 52.6 Dividend pershare.. 2.55p 2.10p 21.4 5.80p Earnings per share (Note1): Excluding net surplus on sale of properties... 9.79p 6.96p 40.7 19.05p Including net surplus on sale of properties 10.40p 7.63p 36.3 21.09p Fully diluted earnings per share: Excluding net surplus on sale of properties 9.01p 6.46p 39.5 17.52p Including net surplus on sale of properties 9.53p 7.04p 35.4 19.29p Notes: 1. The calculations of the earnings per Ordinary share are based respectively on the profit on ordinary activities after taxation before and after including the net surplus on sale of properties divided by the weighted average number of Ordinary shares in issue,411.6 million1985376.7 million). 2. The results for the half years ended 10th August,1985 and 9th August,1986 are unaudited and do not constitute full accounts within the meaning of Section254 of the Companies Act 1985. Chairman's Statement "Results Profits before tax for the first half of the year rose from£46.7 million to £65.4million, an increase of 40 per cent. The net margin increased substantially from3.1 per cent. to 4.1percent. This very satisfactory performance reflects the shopping public's increasing awareness of the improved quality of our new stores, our range of products and our service. Fully diluted earnings per share, including the net surplus on the sale of properties, increased to 9.53p, an increase of 35.4percent. The operating margin, stated before interest receivable and property surplus, also showed a substantial gain, from 2.6percent. to 3.4percent. Sales excluding VAT increased to £1,584million, an increase of 6.6percent. Excluding the sales in the previous half year of the Victor Value and Tesco Ireland businesses, which have now been sold, the sales increase is 13.3percent. After allowing for inflation of 2 per cent., this represents an estimated volume gain of 11 per cent., of which 5 per cent. was generated by existing stores and 6 per cent. from new selling area. Interest receivable includes the capitalised interest cost of funding our development programme of £5.9million, compared to £3.5million for the previous year. Funding Development expenditure and cash flows have progressed very much according to plan. We raised£60 million in June this year by way of a deep discount unsecured loan stock with a nominal value of £125million, an interest coupon of 4 per cent. per annum, giving an effective interest rate of 9.9percent. per annum. It is expected that we will still be in a net cash position at the end of the current financial year. 26