Forecast balance sheets and profit and loss accounts for the year to May 1987 page 4 of 12 previous next
Below is what the machine read from this scan, three times over. They are kept separate rather than merged: where they disagree, the disagreement is itself worth seeing, and a single tidy transcription would hide it.
The left column is raw output. The right is the same text after the repairs that make it searchable — joining letter-spaced words, mending split ones.
Text already in the scan
                                                                                                            A P P E N D I X     B

    Sales                        performance   {% increstses  over     letst  yeetr)

                                            F u l l                                               W e e k s            W e e k s
                                            Y e a r                                             1    t  o     2 8  2 9  t o  5 2
                                               %                                                        %                %

    A c t u a l        S a l e s            1 1 .1                                                1 3   .0    9 .2
    I n fl a t i o n         ( a v e r a g e   t h r o u g h p e r i o d ]          2     .0         1  .8    2 .4
    R e a l      G r o w t h                 9 .1                                                 1 1 .2      6 .8

    E x p l a i n e d        b y

            5 3 r d      W e e k            (1 .9)                                                           (4 .1)
            C l o s e d      s t o r e s    (0 .3)                                                (0 .3)
            N                                                                                                (0 .3)
   e w               s t o r e s                                                    8 .6          1 1 .5               5 .7
            B a s i c    s t o r e s         2 .7

    '    N e w   S t o r e s     a r e     d e fi n e d a s

       ( i  )    A t h e r t o n ,     G l o s s o p    a n d
    (ii) Scarborough Scunthorpe (including petrol), Brownhills (including
                                                             petrol) for the period prior to the anniversary of their opening
    i.e.                              these stores cease to be new after the completion of their first year
    trading          so     that     growth             after that anniversary is     dealt       with      under   'basic
    s t o r e s' .

    •Basic           Stores'     are           all other     stores,     including Lincoln        new which is            treated
    as a         continuation     of           the        old Lincoln     store  and the        stores at     (ii)    above
    p o st-a n n iv e r s a ry .

    Departmenteil     Sales                    Growth

    The overall      basic     store               growth     of 2.7% has       analysed        over   departments       as
f o l l o w s
     Meat + 0.1%; Non Food -11.3%; Produce + 7.5%; Provisions +0.8%;
     Wines & Spirits +9.2%; Tobacco -4.4%; Petrol + 61.5%; Grocery/Bakery
     + 1 . 6 % .
G r o s s M a r g i n s

    Comparative      department                    performance
                                                                                                Yea r       Endings
                                                                                                May    1986     May    1987


  O v e r a l l  1 5 .3 4  1 5 .0 8
  M e a t  2 7 .3 1  2 7 .5 0
  Non  Food  2 6 .5 7  2 5 .8 3
  P rod uce  2 8 .7 8  2 8 .4 5
  Provisions  Group   38  2 7 .5 0  2 7 .2 7
  G r o u p   3 9  1 5 .0 7  1 6 .4 0
  Wines  &  Spirits  8 .6 8  8 .7 1
  petrol  Stations  3 .1 3  5 .0 5
  B a k e r y  5 5 .5 0  6 2 .2 0
  Cigarettes  4 .0 6  3 .9 2
  1 1 .9 7  1 2 .0 1
  G r o c e r y  0 .0 4
  Margin  Adjustment  0 .2 0
APPENDIXB
Sales performance {% increstses over letst yeetr)
FullWeeksWeeks
Year1to2829to52
% % %
ActualSales11 .1 1 3 .0 9 .2
I n fl ation ( averagethroughperiod ] 2 .0 1 .8 2 .4
RealGrowth9 .1 1 1 .2 6 .8
Explainedby
53rdWeek (1 .9) (4 .1)
Closedstores (0 .3) (0 .3)
N (0 .3)
ewstores8 .6 1 1 .5 5 .7
Basicstores2 .7
' NewStoresarede fi nedas
( i ) Atherton , Glossopand
(ii) Scarborough Scunthorpe (including petrol), Brownhills (including
petrol) for the period prior to the anniversary of their opening
i.e. these stores cease to be new after the completion of their first year
trading so that growth after that anniversary is dealt with under 'basic
store s' .
•Basic Stores' are all other stores, including Lincoln new which is treated
as a continuation of the old Lincoln store and the stores at (ii) above
p o st-an n iv ersa ry .
Departmenteil Sales Growth
The overall basic store growth of 2.7% has analysed over departments as
follows
Meat+0.1%; Non Food-11.3%; Produce+7.5%; Provisions+0.8%;
Wines &Spirits+9.2%; Tobacco-4.4%; Petrol+61.5%; Grocery/Bakery
+ 1 . 6 % .
GrossMargins
Comparative department performance
Yea r Endings
May 1986 May 1987
Overall15.3415 .0 8
Meat27.3127 .5 0
Non Food 2 6 .5 725 .8 3
Produce 2 8 .7 828 .4 5
Provisions Group 38 2 7 .5 027 .2 7
Group3915.0716 .4 0
Wines & Spirits 8 .6 8 8 .7 1
petrol Stations 3 .1 3 5 .0 5
Bakery55.5062 .2 0
Cigarettes 4 .0 6 3 .9 2
1 1 .9 712 .0 1
Grocery0 .0 4
Margin Adjustment 0 .2 0Read by machine highest quality of the three
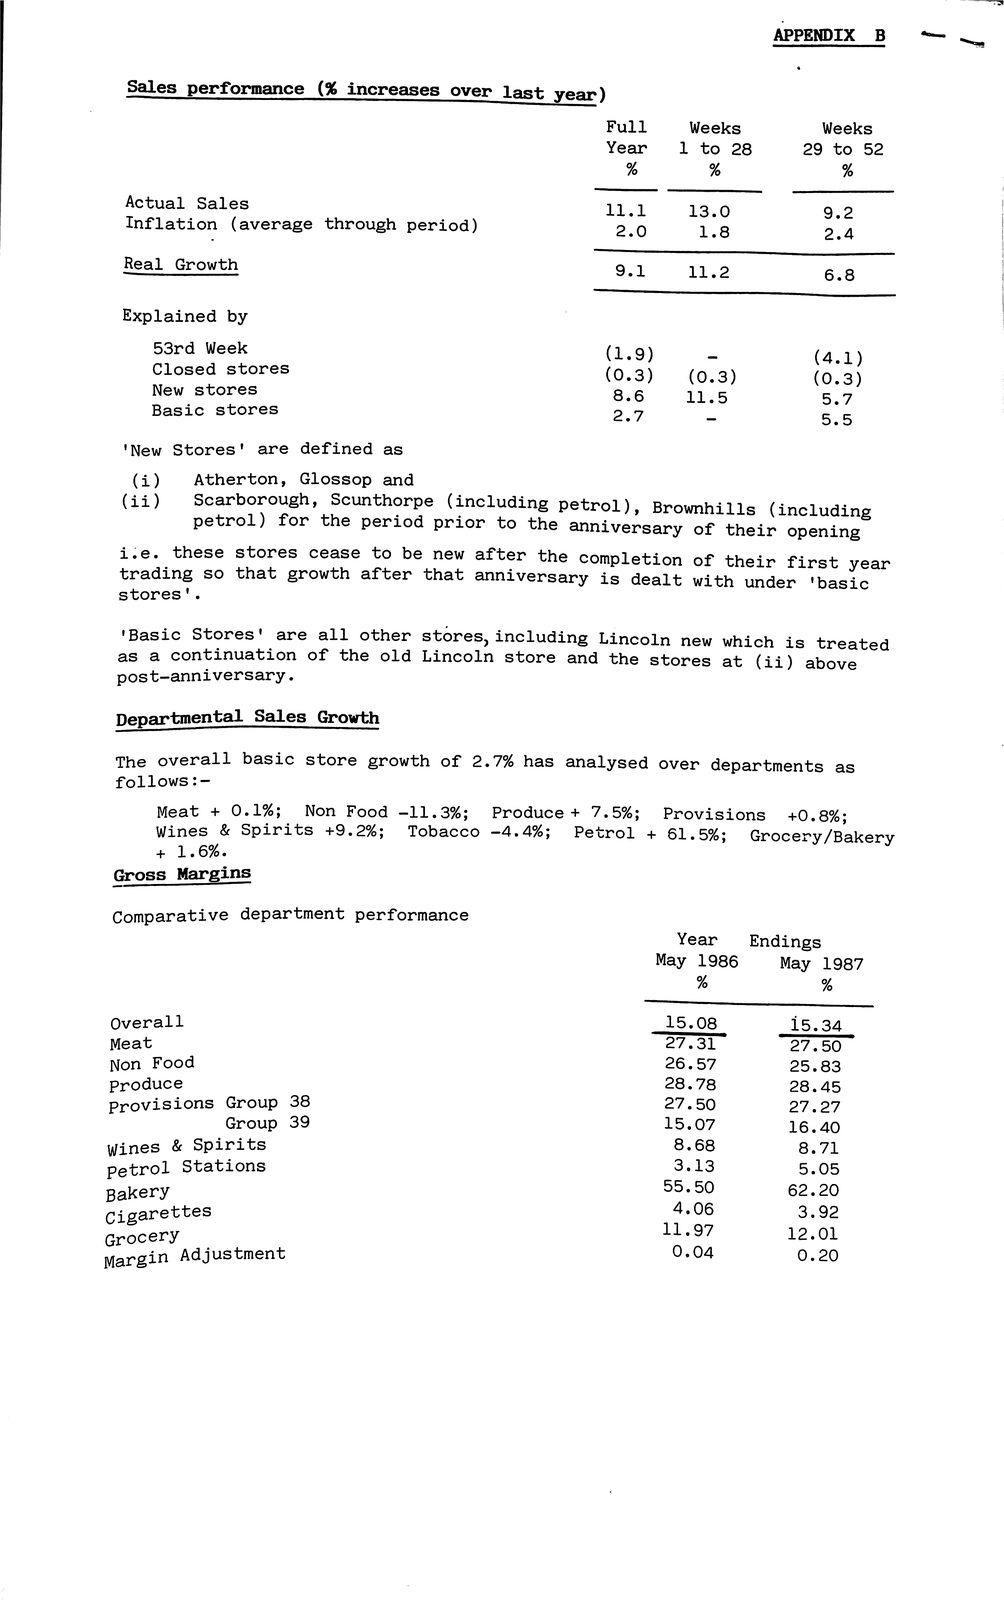
                                                                                                           APPENDIX    B

   Sales          performance        % increases    over   last year)

                                                                             Full          Weeks                  Weeks
                                                                             Year        1 to           28      29 to 52
                                                                             %                 %                    %

   Actual          Sales                                                     11.1          13.0                    9.2
   Inflation          (average       through  period)                             2.0      1.8                     2.4
   Real       Growth                                                         9.1           11.2                    6.8

   Explained          by
           53rd     Week                                                     (1.9)    -             (4.1)
           Closed     stores                                                 (0.3)
                   stores                                                    8.6           11.5                   5.7
           New                                                                             (0.3)    (0.3)
           Basic   stores                                                    2.7      -                           5.5

   'New       Stores'       are  defined   as

        (i)       Atherton,      Glossop   and
 (ii) | Scarborough, Scunthorpe (including petrol), Brownhills
                  petrol)     for     the  period   prior  to  the                                         (including
                                                                              anniversary     of        their  opening
       i.e.   these    stores        cease to   be  new  after the             completion     of        their first year
   trading         so  that      growth    after   that  anniversary      is        dealt  with            under
   stores'.

   'Basic         Stores'     are   all    other   stores,    including     Lincoln      new            which is
   as     a   continuation        of   the    old  Lincoln store      and                                        treated
   post—anniversary.                                                         the     stores             at (ii) above

   Departmental            Sales     Growth

The overall basic store growth of 2.7% has analysed over departments as
       :-
follows

       Non Food -11.3%; Produce 7.5%; Provisions +0.8%;
           Meat    +  0.1%;                                           +
    Wines & Spirits +9.2%; Tobacco -4.4%; Petrol + 61.5%; Grocery/Bakery
    + 1.6%.
Gross Margins

   Comparative          department     performance
                                                                                         Year              Endings
                                                                                 May       1986             May   1987
                                                                                           %                      %

   Overall                                                                                     15.08           15.34
   Meat                                                                                        27.31           27.50
   Non     Food                                                                          26.57                 25.83
   Produce                                                                               28.78                 28.45
   Provisions         Group     38                                                       27.50                 27.27
                      Group     39                                                         15.07               16.40
   wines      &    Spirits                                                                  8.68                8.71
       petrol   Stations                                                                    3.13                5.05
   Bakery                                                                                  55.50               62.20
   cigarettes                                                                               4.06                3.92
   Grocery                                                                                 11.97               12.01
   Margin     Adjustment                                                                    0.04                0.20
APPENDIX B Sales performance % increases over last year) Full Weeks Weeks Year 1 to 28 29 to 52 % % % Actual Sales11.113.0 9.2 Inflation (average through period)2.01.8 2.4 Real Growth9.111.2 6.8 Explained by 53rd Week(1.9)- (4.1) Closed stores(0.3) stores8.611.5 5.7 New (0.3) (0.3) Basic stores2.7- 5.5 'New Stores' are defined as (i) Atherton, Glossop and (ii) | Scarborough, Scunthorpe (including petrol), Brownhills petrol) for the period prior to the (including anniversary of their opening i.e. these stores cease to be new after the completion of their first year trading so that growth after that anniversary is dealt with under stores'. 'Basic Stores' are all other stores, including Lincoln new which is as a continuation of the old Lincoln store and treated post-anniversary. the stores at (ii) above Departmental Sales Growth The overall basic store growth of 2.7% has analysed over departments as :- follows Non Food-11.3%; Produce7.5%; Provisions+0.8%; Meat+0.1%; + Wines &Spirits+9.2%; Tobacco-4.4%; Petrol+61.5%; Grocery/Bakery + 1.6%. Gross Margins Comparative department performance Year Endings May 1986 May 1987 % % Overall15.0815.34 Meat27.3127.50 Non Food26.5725.83 Produce28.7828.45 Provisions Group3827.50 27.27 Group3915.07 16.40 wines &Spirits8.68 8.71 petrol Stations3.135.05 Bakery55.5062.20 cigarettes4.063.92 Grocery11.9712.01 Margin Adjustment0.040.20
Read by machine, contrast corrected
                                                                                                           APPENDIX    B

   Sales          performance        % increases    over   last year)

                                                                             Full          Weeks                  Weeks
                                                                             Year        1 to           28      29 to 52
                                                                             %                 %                    %

   Actual          Sales                                                     11.1          13.0                    9.2
   Inflation          (average       through  period)                             2.0      1.8                     2.4
   Real       Growth                                                         9.1           11.2                    6.8

   Explained          by
           53rd     Week                                                     (1.9)    -             (4.1)
           Closed     stores                                                 (0.3)
                   stores                                                    8.6           11.5                   5.7
           New                                                                             (0.3)    (0.3)
           Basic   stores                                                    2.7      -                           5.5

   'New       Stores'       are  defined   as

        (i)       Atherton,      Glossop   and
 (ii) | Scarborough, Scunthorpe (including petrol), Brownhills
                  petrol)     for     the  period   prior  to  the                                         (including
                                                                              anniversary     of        their  opening
       i.e.   these    stores        cease to   be  new  after the             completion     of        their first year
   trading         so  that      growth    after   that  anniversary      is        dealt  with            under
   stores'.

   'Basic         Stores'     are   all    other   stores,    including     Lincoln      new            which is
   as     a   continuation        of   the    old  Lincoln store      and                                        treated
   post—anniversary.                                                         the     stores             at (ii) above

   Departmental            Sales     Growth

The overall basic store growth of 2.7% has analysed over departments as
       :-
follows

       Non Food -11.3%; Produce 7.5%; Provisions +0.8%;
           Meat    +  0.1%;                                           +
    Wines & Spirits +9.2%; Tobacco -4.4%; Petrol + 61.5%; Grocery/Bakery
    + 1.6%.
Gross Margins

   Comparative          department     performance
                                                                                         Year              Endings
                                                                                 May       1986             May   1987
                                                                                           %                      %

   Overall                                                                                     15.08           15.34
   Meat                                                                                        27.31           27.50
   Non     Food                                                                          26.57                 25.83
   Produce                                                                               28.78                 28.45
   Provisions         Group     38                                                       27.50                 27.27
                      Group     39                                                         15.07               16.40
   wines      &    Spirits                                                                  8.68                8.71
       petrol   Stations                                                                    3.13                5.05
   Bakery                                                                                  55.50               62.20
   cigarettes                                                                               4.06                3.92
   Grocery                                                                                 11.97               12.01
   Margin     Adjustment                                                                    0.04                0.20
APPENDIX B Sales performance % increases over last year) Full Weeks Weeks Year 1 to 28 29 to 52 % % % Actual Sales11.113.0 9.2 Inflation (average through period)2.01.8 2.4 Real Growth9.111.2 6.8 Explained by 53rd Week(1.9)- (4.1) Closed stores(0.3) stores8.611.5 5.7 New (0.3) (0.3) Basic stores2.7- 5.5 'New Stores' are defined as (i) Atherton, Glossop and (ii) | Scarborough, Scunthorpe (including petrol), Brownhills petrol) for the period prior to the (including anniversary of their opening i.e. these stores cease to be new after the completion of their first year trading so that growth after that anniversary is dealt with under stores'. 'Basic Stores' are all other stores, including Lincoln new which is as a continuation of the old Lincoln store and treated post-anniversary. the stores at (ii) above Departmental Sales Growth The overall basic store growth of 2.7% has analysed over departments as :- follows Non Food-11.3%; Produce7.5%; Provisions+0.8%; Meat+0.1%; + Wines &Spirits+9.2%; Tobacco-4.4%; Petrol+61.5%; Grocery/Bakery + 1.6%. Gross Margins Comparative department performance Year Endings May 1986 May 1987 % % Overall15.0815.34 Meat27.3127.50 Non Food26.5725.83 Produce28.7828.45 Provisions Group3827.50 27.27 Group3915.07 16.40 wines &Spirits8.68 8.71 petrol Stations3.135.05 Bakery55.5062.20 cigarettes4.063.92 Grocery11.9712.01 Margin Adjustment0.040.20