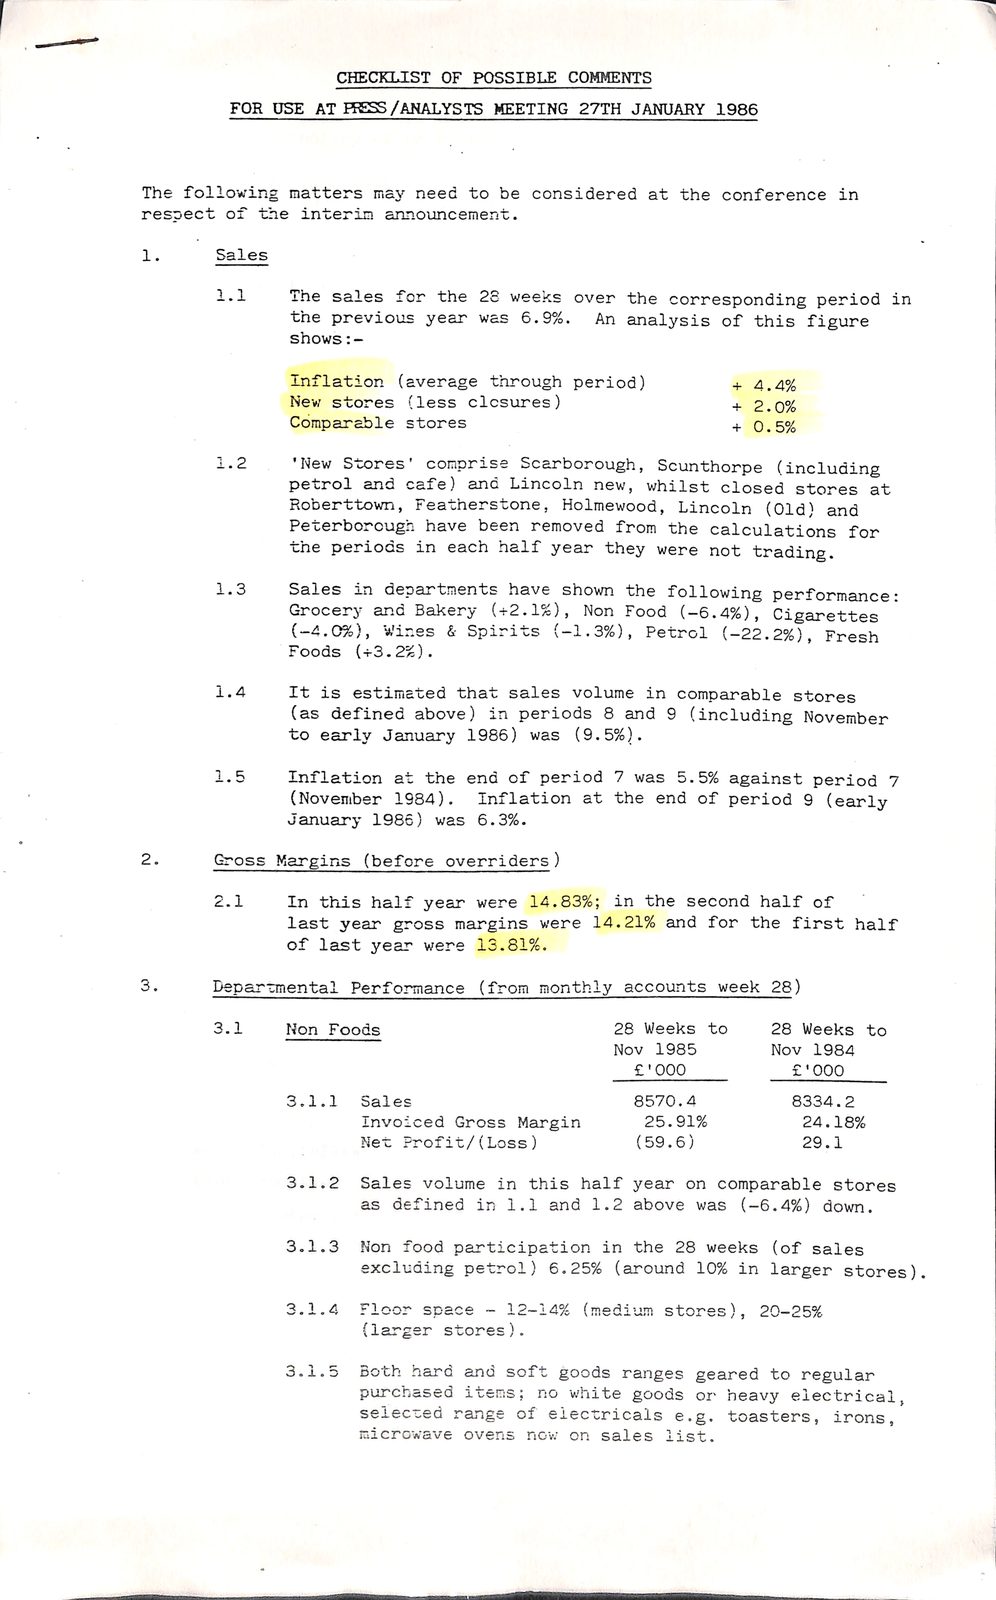
Below is what the machine read from this scan, three times over. They are kept separate rather than merged: where they disagree, the disagreement is itself worth seeing, and a single tidy transcription would hide it.
The left column is raw output. The right is the same text after the repairs that make it searchable — joining letter-spaced words, mending split ones.
Text already in the scan highest quality of the three
        CHECKLIST OF POSSIBLE COMMENTS
FOR DSE AT HSSS/ANALYSTS MEETING 27TH JANUARY 1986


The following matters may need to be considered at the conference in
resoect of the interim announcement.

    1.   Sales

         1.1     The  sales       for    the  28  weeks   over   the   corresponding        period  in
                the   previous        year    was   6.9%.   An   analysis          of this  figure
                shows

                Inflation         (average    through       period)                +  4.4%
                Nev/  stores        (less    closures)                             +  2.0%
                Comparable        stores                                           +  0.5%
         1.2    'New Stores'          comprise         Scarborough,  Scunthorpe         (including
                 petrol       and   cafe)    and  Lincoln    new,   whilst     closed      stores at
                 Roberttown,          Featherstone, Holmewood,          Lincoln       (Old)   and
                 Peterborough         have    been  removed    from    the   calculations      for
                 the  periods         in each    half year     they  were not         trading.
         1.3     Sales     in   departments       have   shown   the        following  performance:
                 Grocery      and     Bakery  (+2.1%),     Non   Food   (-6.4%),       Cigarettes
                (-4.0%),        Wines  &•   Spirits      (-1.3%),   Petrol     (-22.2%),     Fresh
                 Foods     (+3.2%) .

         1.4     It     is  estimated that        sales    volume   in  comparable         stores
                (as   defined         above)  in    periods  8   and   9   (including      November
                 to  early        January   1986)   was     (9.5%).

         1.5     Inflation       at   the   end     of period  7  was    5.5%       against period 7
                (November          1984).     Inflation    at  the   end    of period      9 (early
                 January      1985)     was   6.3%.
    2.   Gross  Margins      (before     overriders )

         2.1     In     this      half year   were    14.83%;  in   the    second     half of
                 last     year   gross     margins    were   14.21% and      for      the first  half
                 of last      year     were   13.81%.

    3.   Departmental           Performance   (from  monthly        accounts     week  28)

         3.1     Non  Foods                                    28   Weeks    to        28  Weeks  to
                                                               Nov   1985              Nov   1984
                                                                  £'000                   £'000
                 3.1.1       Sales                                8570.4                   8334.2
                             Invoiced     Gross     Margin          25.91%                 24.18%
                             Net  Profit/(Loss)                   (59.6)                   29.1

                 3.1.2       Sales    volume     in this    half year     on comparable       stores
                             as  defined      in 1.1   and  1.2   above     was    (-6.4%)   down.

                 3.1.3       Non  food      participation    in   the    28     weeks  (of  sales
        excluding petrol) 6.25% (around 10% in larger stores) .

                 3.1.4       Floor    space   - 12-14%      (medium    stores),       20-25%
                             (larger     stores) .

                 3.1    .5   Both    hard   and soft    goods      ranges   geared     to  regular
                             purchased      items;   no   white   goods     or     heavy  electrical,
                             selected     range     of eiectricals       e.g.      toasters,  irons,
                             microwave      ovens   now   on  sales     list.
CHECKLIST OF POSSIBLE COMMENTS FOR DSE AT HSSS/ANALYSTS MEETING 27TH JANUARY1986 The following matters may need to be considered at the conference in resoect of the interim announcement. 1. Sales 1.1 The sales for the 28 weeks over the corresponding period in the previous year was 6.9%. An analysis of this figure shows Inflation (average through period)+4.4% Nev/ stores (less closures)+2.0% Comparable stores+0.5% 1.2 'New Stores' comprise Scarborough, Scunthorpe (including petrol and cafe) and Lincoln new, whilst closed stores at Roberttown, Featherstone, Holmewood, Lincoln (Old) and Peterborough have been removed from the calculations for the periods in each half year they were not trading. 1.3Sales in departments have shown the following performance: Grocery and Bakery(+2.1%), Non Food(-6.4%), Cigarettes (-4.0%),Wines&• Spirits(-1.3%), Petrol(-22.2%), Fresh Foods(+3.2%). 1.4 It is estimated that sales volume in comparable stores (as defined above) in periods 8 and 9 (including November to early January1986) was (9.5%). 1.5Inflation at the end of period 7 was 5.5%against period 7 (November1984). Inflation at the end of period 9 (early January1985) was 6.3%. 2. Gross Margins (before overriders ) 2.1 In this half year were14.83%; in the second half of last year gross margins were14.21% and for the first half of last year were13.81%. 3. Departmental Performance (from monthly accounts week28) 3.1 Non Foods 28 Weeks to 28 Weeks to Nov 1985 Nov 1984 £'000 £'000 3.1.1Sales8570.4 8334.2 Invoiced Gross Margin25.91%24.18% Net Profit/(Loss) (59.6) 29.1 3.1.2Sales volume in this half year on comparable stores as defined in 1.1 and 1.2above was (-6.4%)down. 3.1.3 Non food participation in the 28 weeks (of sales excluding petrol)6.25% (around10% in larger stores) . 3.1.4Floor space-12-14% (medium stores),20-25% (larger stores) . 3.1.5Both hard and soft goods ranges geared to regular purchased items; no white goods or heavy electrical, selected range of eiectricals e.g. toasters, irons, microwave ovens now on sales list.
Read by machine
    CHECKLIST OF POSSIBLE COMMENTS

FOR USE AT PRESS/ANALYSTS MEETING 27TH JANUARY 1986


The following matters may need to be considered at the conference in
ressect of the interim announcement.

    1.   Sales

         1.1        The   sales         for the    2&8  weeks   over   the  corresponding              period in
                    the   previous          year   wes    6.9%.   An   analysis        of      this figure
                    shows   :-

                    Inflation           (average   through     period)                      +  4.4%
                    New   stores         (less     clcsures)                                +  2.0%
                                         stores                                             +  0.5%

         i.2        "New                    comprise      Scarborough,     Scunthorpe
                    petrol                                                                         (including
                                    and  cafe)     and  Lincoln    new,  whilst        closed      stores  at
        Roberttown, Featherstone, Holmewood, Lincoln (Old) and
                    Peterborougn            have   been    removed   from   the       calculations        for
        the periods in each half year they were not trading.
         j~   Ww    Sales     in     departments        have   shown   the  following         performance:
                    Grocery       and     Bakery (+2.1%),        Non   Food   (-6.4%),             Cigarettes
                    (-4.0%),      Wines       &    Spirits   (-1.3%),    Petrol        (-22.2%),        Fresh
                    Foods     (+3.2%).

         Sud        It  is    estimated         that    sales   volume   in   comparable           stores
                    (as   defined         above)   in     periods  8   and  9    (including           November
                    to  early     January          1986   was (9.5%).

              (a)   Inflation          at   the    end  of  period   7  was   5.5%          against   period  7
                    (November          1984).      Inflation     at  the   end      of      period  9   (early
                   January        1986       was   6.3%.

    2.   Gross                    (before          overriders
                  Margins                                   )

         2.1       In   this      half      year   were    14.83%;   in  the     second        half   of
                   last        year    gross    margins     were 14.21%        and    for     the  first  half
                   of   last      year      were   13.81%.

    3:   Departmental                Performance   (from    monthly    accounts        week   28

         3.1       Non        Foods                                  28      Weeks    to      28    Weeks   to
                                                                     Nov      1985            Nov     1984
                                                                        £'O00                      £'O0O

                   3.1.1      Sales                                     8570.4                      8334.2
                              Invoiced          Gross     Margin              25.91%                24.18%
                              Net       Profit/(Loss)                   (59.6)                      29.1

                   3.1.2      Sales       volume       in  this  half   year      on   comparable       stores
                              as       defined     in   1.1  and  1.2   above       was       (-6.4%) down.

                   3.1.3      Non       food    participation      in   the     28    weeks   (of     sales
        excluding petrol) 6.25% (around 10% in larger stores).

                   (WO        q =  $ Ww) ia)     e   -  12-14%    (medium
                              2                                             stores),           20-25%

                                                        /

                   ev)        Both         hard  and    soft  goods   ranges        geared    to    regular
                              purchased          items;    no   white   goods       or      heavy  electrical,
        selected range of electricals €.g. toasters, irons,
                              microwave          ovens    now   on sales    5
CHECKLIST OF POSSIBLE COMMENTS FOR USE AT PRESS/ANALYSTS MEETING 27TH JANUARY1986 The following matters may need to be considered at the conference in ressect of the interim announcement. 1. Sales 1.1 The sales for the 2&8weeks over the corresponding period in the previous year wes 6.9%. An analysis of this figure shows :- Inflation (average through period)+4.4% New stores (less clcsures) + 2.0% stores+0.5% i.2 "New comprise Scarborough, Scunthorpe petrol (including and cafe) and Lincoln new, whilst closed stores at Roberttown, Featherstone, Holmewood, Lincoln (Old) and Peterborougn have been removed from the calculations for the periods in each half year they were not trading. j~ Ww Sales in departments have shown the following performance: Grocery and Bakery(+2.1%), Non Food(-6.4%), Cigarettes (-4.0%),Wines& Spirits(-1.3%), Petrol(-22.2%), Fresh Foods(+3.2%). Sud It is estimated that sales volume in comparable stores (as defined above) in periods 8 and 9 (including November to early January1986 was (9.5%). (a) Inflation at the end of period 7 was 5.5%against period 7 (November1984). Inflation at the end of period 9 (early January1986 was 6.3%. 2. Gross (before overriders Margins ) 2.1 In this half year were14.83%; in the second half of last year gross margins were14.21% and for the first half of last year were13.81%. 3: Departmental Performance (from monthly accounts week 28 3.1 Non Foods 28 Weeks to 28 Weeks to Nov 1985 Nov 1984 £'O00 £'O0O 3.1.1Sales8570.4 8334.2 Invoiced Gross Margin25.91%24.18% Net Profit/(Loss) (59.6) 29.1 3.1.2Sales volume in this half year on comparable stores as defined in 1.1 and 1.2above was (-6.4%)down. 3.1.3 Non food participation in the 28 weeks (of sales excluding petrol)6.25% (around10% in larger stores). (WO q = $ Ww) ia) e -12-14%(medium 2stores),20-25% / ev) Both hard and soft goods ranges geared to regular purchased items; no white goods or heavy electrical, selected range of electricals €.g. toasters, irons, microwave ovens now on sales 5
Read by machine, contrast corrected
    CHECKLIST OF POSSIBLE COMMENTS

FOR USE AT PRESS/ANALYSTS MEETING 27TH JANUARY 1986


The following matters may need to be considered at the conference in
        of the interim announcement.

    1. Sales

                  The   sales       for the    2&8 weeks   over   the  corresponding          period in
                  the   previous        year   wes  6.9%.    An   analysis      of    this figure
                  shows  :-

                  Inflation         (average   through       period)               +  4.4%
                  New   stores       (less     clcsures)                           +  2.0%
                                     stores                                        +  0.5%

       i.2        "New                  comprise        Scarborough,  Scunthorpe
                  petrol                                                                  (including
                                and  cafe)     and Lincoln  new,      whilst    closed     stores at
        Roberttown, Featherstone, Holmewood, Lincoln (Old) and
                  Peterborougn          have   been removed     from   the   calculations        for
        the periods in each half year they were not trading.
             Ww   Sales     in     departments     have   shown   the  following     performance:
                  Grocery     and     Bakery   (+2.1%),     Non   Food     (-6.4%),       Cigarettes
                  (-4.0%),     Wines     &     Spirits  (-1.3%),      Petrol    (-22.2%),      Fresh
                  Foods     (+3.2%).

       foal       It  is    estimated     that     sales    volume    in   comparable     stores
                  (as   defined       above)   in   periods 8     and    9 (including      November
                  to  early     January        1986  was     (9.5%).

       js  (94)   Inflation        at   the    end of  period   7  was     5.5%    against   period  7
                  (November        1984).      Inflation    at  the   end    of    period  9   (early
                 January     1986        was   6.3%.

       Gross                (before           overriders
           Margins                                     )

       2.1       In   this     half     year   were   14.83%;   in    the  second     half   of
                 last      year    gross    margins    were 14.21%      and  for     the  first  half
                 of   last  year        were   13.81%.

                                 Performance   (from   monthly    accounts   week    28

       3.1       Non      Foods                                 28    Weeks  to      28    Weeks   to
                                                                Nov    1985          Nov     1984


                 3.1.1          Sales                                  8570.4             8334.2
                                Invoiced           Gross  Margin       25.91%               24.18%
                                Net  Profit/(Loss)                     (59.6)               29.1

                 3.1.2          Sales    volume         in this  half  year  on     comparable stores
                                as  defined          in  1.1 and  1.2  above     was (-6.4%)   down.

                 3.1.3          Non  food          participation   in  the  28   weeks  (of  sales
                                excluding           petrol)   6.25% (around      10% in larger  stores).

                 W     ~           > 2 $ Ww) ie)    e -  12-14%   (medium  stores),     20-25%
                                                         j
                                                         /

                 ev)  lod  Qi   Both          hard  and  soft goods   ranges     geared to  regular
                                purchased           items;   no white  goods     or  heavy electrical,
       selected range of electricals €.g. toasters, irons,
       microwave ovens now on sales list.
CHECKLIST OF POSSIBLE COMMENTS FOR USE AT PRESS/ANALYSTS MEETING 27TH JANUARY1986 The following matters may need to be considered at the conference in of the interim announcement. 1. Sales The sales for the 2&8weeks over the corresponding period in the previous year wes 6.9%. An analysis of this figure shows :- Inflation (average through period)+4.4% New stores (less clcsures) + 2.0% stores+0.5% i.2 "New comprise Scarborough, Scunthorpe petrol (including and cafe) and Lincoln new, whilst closed stores at Roberttown, Featherstone, Holmewood, Lincoln (Old) and Peterborougn have been removed from the calculations for the periods in each half year they were not trading. Ww Sales in departments have shown the following performance: Grocery and Bakery(+2.1%), Non Food(-6.4%), Cigarettes (-4.0%),Wines& Spirits(-1.3%), Petrol(-22.2%), Fresh Foods(+3.2%). foal It is estimated that sales volume in comparable stores (as defined above) in periods 8 and 9 (including November to early January1986 was (9.5%). js (94)Inflation at the end of period 7 was 5.5%against period 7 (November1984). Inflation at the end of period 9 (early January1986 was 6.3%. Gross (before overriders Margins ) 2.1 In this half year were14.83%; in the second half of last year gross margins were14.21% and for the first half of last year were13.81%. Performance (from monthly accounts week 28 3.1 Non Foods 28 Weeks to 28 Weeks to Nov 1985 Nov 1984 3.1.1Sales8570.4 8334.2 Invoiced Gross Margin25.91%24.18% Net Profit/(Loss) (59.6) 29.1 3.1.2Sales volume in this half year on comparable stores as defined in 1.1 and 1.2above was (-6.4%)down. 3.1.3 Non food participation in the 28 weeks (of sales excluding petrol)6.25% (around10% in larger stores). W ~ > 2 $ Ww) ie) e -12-14%(medium stores),20-25% j / ev) lod Qi Both hard and soft goods ranges geared to regular purchased items; no white goods or heavy electrical, selected range of electricals €.g. toasters, irons, microwave ovens now on sales list.