Hillards Annual report and accounts 1977 page 18 of 24 previous next
Below is what the machine read from this scan, three times over. They are kept separate rather than merged: where they disagree, the disagreement is itself worth seeing, and a single tidy transcription would hide it.
The left column is raw output. The right is the same text after the repairs that make it searchable — joining letter-spaced words, mending split ones.
Text already in the scan highest quality of the three
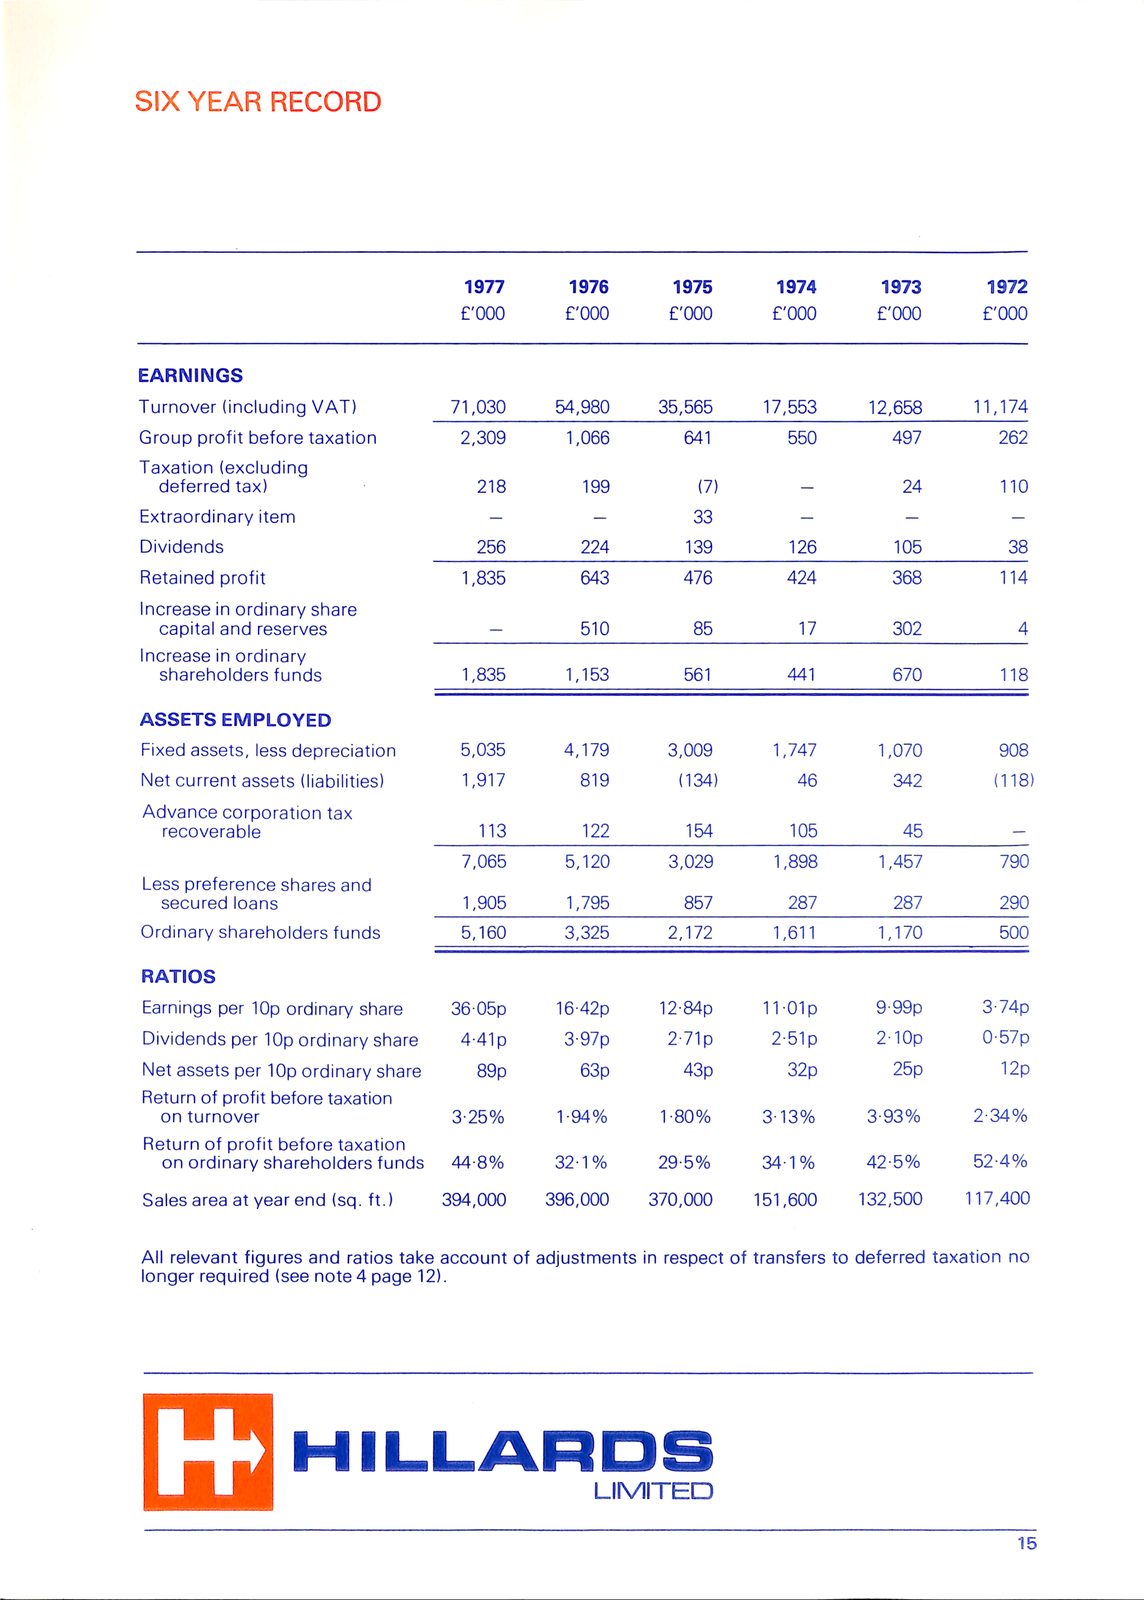
SIX YEAR RECORD


1977     1976    1975    1974    1973 1972
£'0(X)   £'000   £'000   £'000   £'000 £'000


EARNINGS
Turnover (including VAT)               71,030    54,980    35,565       17,553           12,658       11,174
Group profit before taxation            2,309     1,066       641          550              497          262
Taxation (excluding
deferred tax)                            2 18       199     (7)                              24         1 10
Extraordinary item    -    -                                   33      -               -                  -
Dividends                                 256       224       139          126              105           38
Retained profit                         1,835       643       476          424              368         1 14
Increase in ordinary share
capital and reserves                                510        85           17              302            4
Increase in ordinary
shareholders funds                      1,835     1,153       561          441              670         1 18

ASSETS EMPLOYED
Fixed assets, less depreciation         5,035     4,179     3,009        1,747            1,070          908
Net current assets (liabilities)        1,917      8 19    (134)            46              342    (118)
Advance corporation tax
recoverable                               113       122     154            105               45
                                        7,065     5,120    3,029         1,898            1,457          790
Less preference shares and
secured loans                           1,905     1,795       857          287              287       290
Ordinary shareholders funds             5,160     3,325     2,172        1,611            1,170          500

RATIOS
Earnings per  lOp ordinary share        3605p    16-42p        12-84p   11-Olp            9-99p    3  74p
Dividends per lOp ordinary share        4-41p     3-97p     2-71p        2-51p            2-10p        0-57p
Net assets per    lOp ordinary share      89p       63p       43p          32p              25p          12p
Return of profit before taxation
on turnover                             3-25%    1 -94%     1-80%        3-13%            3-93%        2-34%
Return of profit before taxation
on ordinary shareholders funds          44-8%     32-1%     29-5%        34-1%            42-5%        52-4%
Sales area at year end (sq. ft.)      394,000   396,000       370,000  151,600          132,500      117,400

All relevant figures and ratios take account of adjustments in respect of transfers to  deferred taxation no
longer required (see note 4 page 12).


If                                              HILLARDS
                                                 LIMITED

                                                                                                          15
SIX YEAR RECORD 1977 1976 1975 1974 1973 1972 £'0(X) £'000 £'000 £'000 £'000 £'000 EARNINGS Turnover (including VAT) 71,030 54,980 35,565 17,553 12,658 11,174 Group profit before taxation2,3091,066 641 550 497 262 Taxation (excluding deferred tax) 2 18 199 (7) 24 1 10 Extraordinary item - - 33 - - - Dividends256224 139 126 105 38 Retained profit1,835643 476 424 368 1 14 Increase in ordinary share capital and reserves51085 17 302 4 Increase in ordinary shareholders funds1,8351,153 561 441 670 1 18 ASSETS EMPLOYED Fixed assets, less depreciation5,0354,179 3,009 1,747 1,070 908 Net current assets (liabilities)1,9178 19 (134) 46 342 (118) Advance corporation tax recoverable113122 154 105 45 7,065 5,120 3,029 1,898 1,457 790 Less preference shares and secured loans1,9051,795 857 287 287 290 Ordinary shareholders funds5,1603,325 2,172 1,611 1,170 500 RATIOS Earnings per lOp ordinary share 3605p 16-42p 12-84p 11-Olp 9-99p 3 74p Dividends per lOp ordinary share 4-41p 3-97p 2-71p 2-51p 2-10p 0-57p Net assets per lOp ordinary share 89p 63p 43p 32p 25p 12p Return of profit before taxation on turnover3-25%1 -94% 1-80% 3-13% 3-93% 2-34% Return of profit before taxation on ordinary shareholders funds44-8%32-1% 29-5% 34-1% 42-5% 52-4% Sales area at year end (sq. ft.) 394,000 396,000 370,000 151,600 132,500 117,400 All relevant figures and ratios take account of adjustments in respect of transfers to deferred taxation no longer required (see note 4page12). If HILLARDS LIMITED 15
Read by machine
  SIX YEAR RECORD


1977  1976   1975  1974   1973  1972
£'000 £'000 £'000  £'000 £'000  £’000


  EARNINGS

  Turnover (including VAT)                 71,030       54,980                35,565       17,553      12,658         11,174
  Group profit before taxation             2,309         1,066                                560         497            262  641
  Taxation (excluding
  deferred tax)                                   218      199             (7)                             24            110

  Extraordinary item                                         _                    33    -                   —
  Dividends                                   256          224                   139          126         105             38

  Retained profit                          1,835           643                   476          424         368    114
  Increase in ordinary share
  capital and  reserves                                    510                    85           17         302              4
  Increase in ordinary
  shareholders funds                       1,835         1,153                          441               670            118  561

  ASSETS EMPLOYED

  Fixed  assets, less depreciation         5,035         4,179                 3,009        1,747       1,070            908
  Net current assets (liabilities)         1,917           819             (134)               46         342    (118)
  Advance corporation     tax
      recoverable                                 113      122                   154          105          45        —
                                           7,065         5,120                 3,029        1,898       1,457            790
  Less preference shares and
      secured loans                             1,905    1,795                   857          287         287            290
  Ordinary shareholders funds              5,160         3,325                 2,172                    1,170            500  1,611

  RATIOS

  Earnings per   10p ordinary share        36:05p                             12:84p       11-01p      9-:99p          3:74p
  Dividends    per   10p ordinary share    4-41p         3:97p                 2:71p        2:51p                      0-57p
  Net assets   per   10p ordinary share           89p      63p                   43p          32p         25p            12p
  Return of profit before taxation
      on turnover                           3:25%      1:94%               1:80%            3:93%           2:34%
  Return of profit before taxation
      on ordinary shareholders funds        44:8%      32:1%               29:5%        34:1%               52-4%
  Sales  area  at year  end (sq. ft.)         394,000    396,000             370,000      151,600     132,500    117,400

  All relevant figures and ratios take        account    of adjustments in respect     of transfers  to deferred taxation no
  longer required (see note 4 page     12).


                                                                                                                 15
SIX YEAR RECORD 1977 1976 1975 1974 1973 1972 £'000 £'000 £'000 £'000 £'000 £'000 EARNINGS Turnover (including VAT) 71,030 54,980 35,565 17,553 12,658 11,174 Group profit before taxation2,3091,066 560 497 262 641 Taxation (excluding deferred tax) 218 199 (7) 24 110 Extraordinary item _ 33 - - Dividends256224 139 126 105 38 Retained profit1,835643 476 424 368 114 Increase in ordinary share capital and reserves51085 17 302 4 Increase in ordinary shareholders funds1,8351,153 441 670 118 561 ASSETS EMPLOYED Fixed assets, less depreciation5,0354,179 3,009 1,747 1,070 908 Net current assets (liabilities)1,917819 (134) 46 342 (118) Advance corporation tax recoverable113122 154 105 45 - 7,065 5,120 3,029 1,898 1,457 790 Less preference shares and secured loans1,9051,795 857 287 287 290 Ordinary shareholders funds5,1603,325 2,172 1,170 500 1,611 RATIOS Earnings per 10p ordinary share 36:05p 12:84p 11-01p 9-:99p 3:74p Dividends per 10p ordinary share 4-41p 3:97p 2:71p 2:51p 0-57p Net assets per 10p ordinary share 89p 63p 43p 32p 25p 12p Return of profit before taxation on turnover3:25%1:94% 1:80% 3:93% 2:34% Return of profit before taxation on ordinary shareholders funds44:8%32:1% 29:5% 34:1% 52-4% Sales area at year end (sq. ft.) 394,000 396,000 370,000 151,600 132,500 117,400 All relevant figures and ratios take account of adjustments in respect of transfers to deferred taxation no longer required (see note 4page12). 15
Read by machine, contrast corrected
    SIX YEAR RECORD


1977  1976 1975 1974 1973 1972
£000  £000      £'000     £°000


    EARNINGS

    Turnover (including VAT)                 71,030         54,980            35,565     17,553         12,658        11,174
    Group profit before taxation             2,309           1,066                          560                          262  641  497
    Taxation (excluding
    deferred tax)                                   218        199           (7)                            24           110

    Extraordinary item                                                            33    -                    —
    Dividends                                   256            224               139        126            105            38

    Retained profit                          1,835             643               476        424         368       114
    Increase in ordinary share
    capital and  reserves                         _            510                85         17                            4    302
    Increase in ordinary
    shareholders funds                       1,835  1,153                               441                670           118 561

    ASSETS EMPLOYED

    Fixed  assets, less depreciation         5,035           4,179             3,009      1,747          1,070           908
    Net current assets (liabilities)         1,917             819           (134)           46            342    (118)
    Advance corporation     tax
        recoverable                                 113        122               154        105             45        —
                                             7,065           5,120             3,029      1,898          1,457           790
    Less preference shares and
        secured loans                             1,905      1,795               857        287            287           290
    Ordinary shareholders funds              5,160           3,325             2,172                     1,170           500  1,611

    RATIOS

    Earnings per   10p ordinary share        36:05p         16-42p            12:84p    11-:01p          9-99p
    Dividends    per   10p ordinary share    4-41p           3:97p             2:71p      2:51p                        0-57p
    Net assets   per   10p ordinary share           89p        63p               43p        32p            25p           12p
    Return of profit before taxation
        on turnover                           3:25%        1:94%             1:80%      3°13%           3:93%     2:34%
    Return of profit before taxation
        on ordinary shareholders funds        44:8%      32:1%               29:5%      34:1%            42:5%    52-4%
    Sales  area  at year  end (sq. ft.)         394,000    396,000           370,000    151,600        132,500    117,400

    All relevant figures and ratios take        account    of adjustments in respect    of transfers to deferred taxation no
    longer required (see note 4 page     12).


                                                                                                                  15
SIX YEAR RECORD 1977 1976 1975 1974 1973 1972 £000 £000 £'000 £°000 EARNINGS Turnover (including VAT) 71,030 54,980 35,565 17,553 12,658 11,174 Group profit before taxation2,3091,066 560 262 641 497 Taxation (excluding deferred tax) 218 199 (7) 24 110 Extraordinary item 33 - - Dividends256224 139 126 105 38 Retained profit1,835643 476 424 368 114 Increase in ordinary share capital and reserves_510 85 17 4 302 Increase in ordinary shareholders funds1,8351,153 441 670 118 561 ASSETS EMPLOYED Fixed assets, less depreciation5,0354,179 3,009 1,747 1,070 908 Net current assets (liabilities)1,917819 (134) 46 342 (118) Advance corporation tax recoverable113122 154 105 45 - 7,065 5,120 3,029 1,898 1,457 790 Less preference shares and secured loans1,9051,795 857 287 287 290 Ordinary shareholders funds5,1603,325 2,172 1,170 500 1,611 RATIOS Earnings per 10p ordinary share 36:05p 16-42p 12:84p 11-:01p 9-99p Dividends per 10p ordinary share 4-41p 3:97p 2:71p 2:51p 0-57p Net assets per 10p ordinary share 89p 63p 43p 32p 25p 12p Return of profit before taxation on turnover3:25%1:94% 1:80% 3°13% 3:93% 2:34% Return of profit before taxation on ordinary shareholders funds44:8%32:1% 29:5% 34:1% 42:5% 52-4% Sales area at year end (sq. ft.) 394,000 396,000 370,000 151,600 132,500 117,400 All relevant figures and ratios take account of adjustments in respect of transfers to deferred taxation no longer required (see note 4page12). 15