Hillards Annual report and accounts 1976 page 20 of 24 previous next
Below is what the machine read from this scan, three times over. They are kept separate rather than merged: where they disagree, the disagreement is itself worth seeing, and a single tidy transcription would hide it.
The left column is raw output. The right is the same text after the repairs that make it searchable — joining letter-spaced words, mending split ones.
Text already in the scan
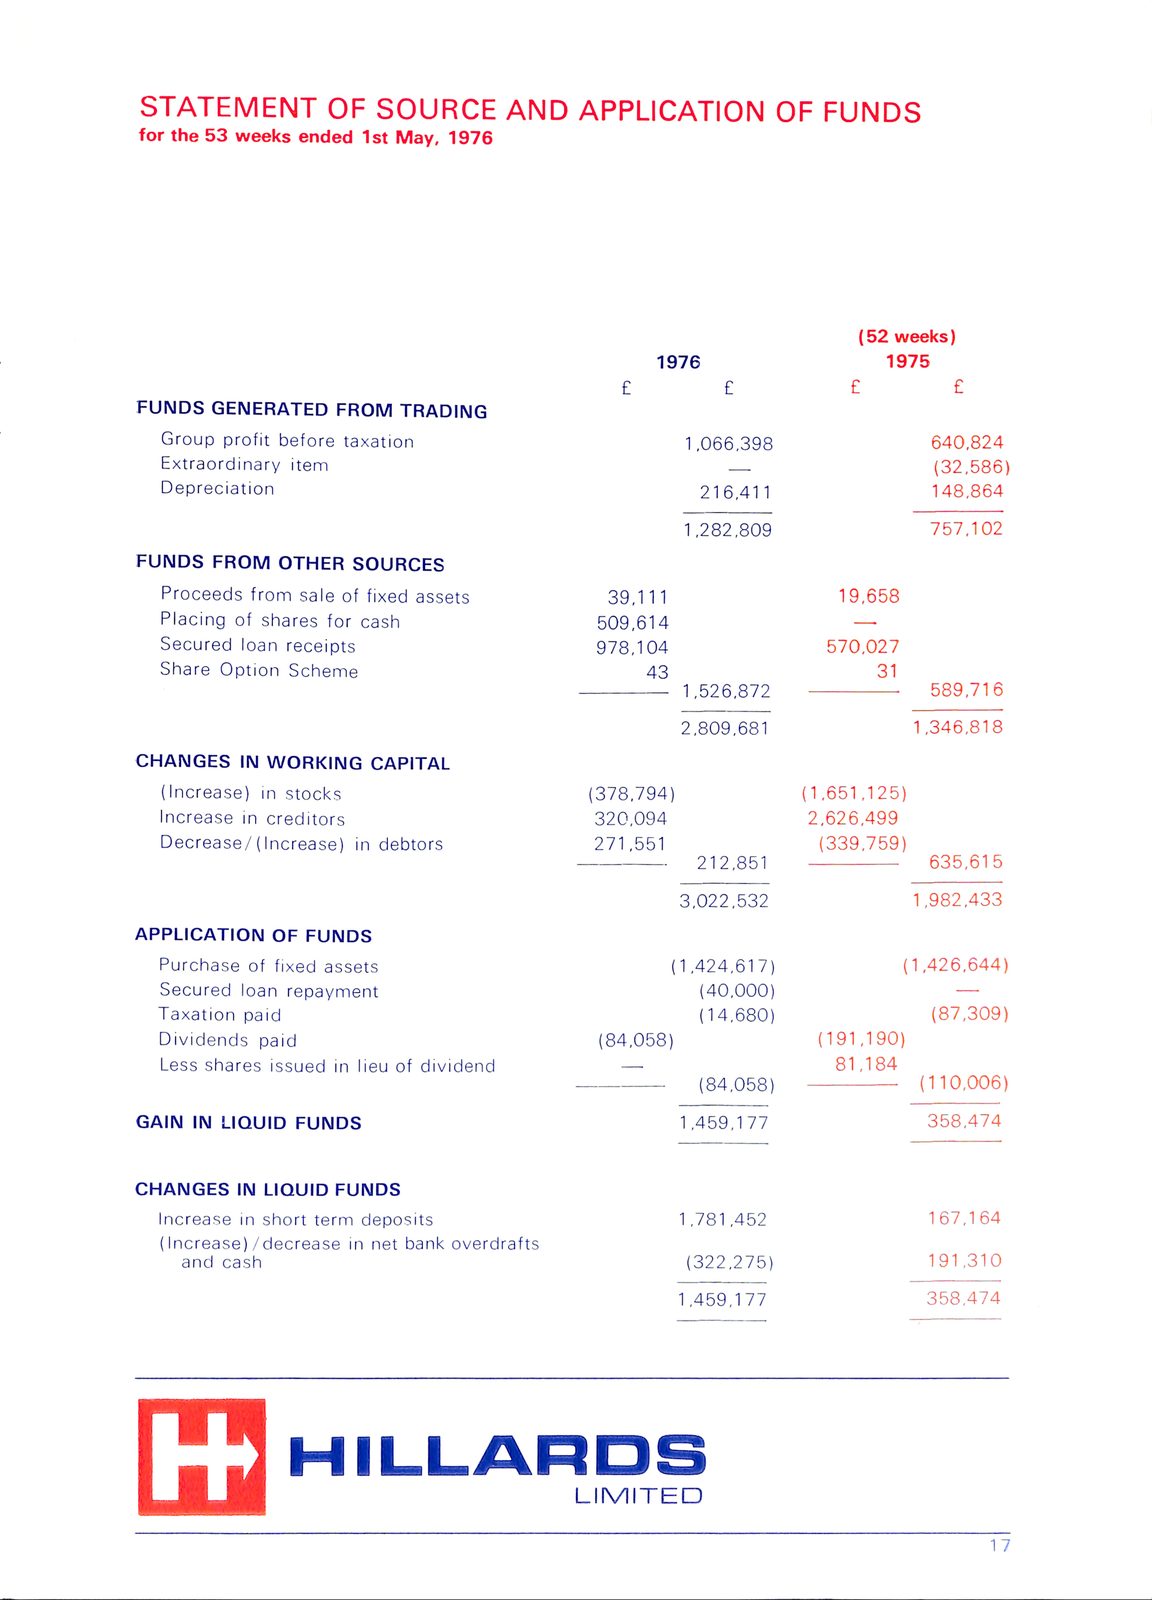
STATEMENT OF SOURCE AND APPLICATION OF FUNDS
for the 53 weeks ended 1st May, 1976


                                                           (52 weeks)
                                                      1976    1975
                                                      £             £             £             £
FUNDS GENERATED FROM TRADING
Group profit    before     taxation                                1,066,398                    640,824
Extraordinary     item                                                                          (32,586)
Depreciation                                                        2 16,4 1 1                  148,864
                                                                   1,282,809                    757,102
FUNDS FROM OTHER SOURCES
Proceeds from sale of     fixed     assets            39,111                      19,658
Placing   of sftares       for    cash                509,614
Secured   loan        receipts                        978,104                     570,027
Share            Option Scheme                           43        1,526,872         3 1        589,7 16

                                                                   2,809,68 1                  1,346,8 18
CHANGES IN WORKING CAPITAL
(Increase)   in     stocks        (378,794)                             (1,651,125)
Increase  in     creditors                            320,094           2,626,499
Decrease/(Increase)             in     debtors        27 1,55 1     2 12,85 1     (339,759)     635,6 15
                                                                   3,022,532                    1,982,433
APPLICATION OF FUNDS
Purchase of fixed            assets    (1,424,617)                                    ;i,426,644)
Secured   loan            repayment                                 (40,000)
Taxation  paid                                                      (14,680)                    (87,309)
Dividends    paid                                     (84,058)                    (191,190)
Less shares  issued     in     lieu    of dividend                  (84,058)      8 1,184       (110,006)
GAIN IN LIQUID FUNDS                                               1,459,177                    358,474


CHANGES IN LIQUID FUNDS
Increase in short term deposits           1,78 1,452                                              167,164
(Increase)/decrease in net bank overdrafts
and cash                                                           (322,275)                    19 1,3 10

                                          1,459,177                                               358,474


          HILLARDS
          LIMITED

                                                                                                17
STATEMENT OF SOURCE AND APPLICATION OF FUNDS for the 53 weeks ended 1st May, 1976 (52weeks) 1976 1975 ££££ FUNDS GENERATED FROM TRADING Group profit before taxation1,066,398640,824 Extraordinary item(32,586) Depreciation216,4 1 1 148,864 1,282,809 757,102 FUNDS FROM OTHER SOURCES Proceeds from sale of fixed assets39,11119,658 Placing of sftares for cash509,614 Secured loan receipts978,104570,027 Share Option Scheme431,526,872 3 1 589,7 16 2,809,68 1 1,346,8 18 CHANGES IN WORKING CAPITAL (Increase) in stocks(378,794)(1,651,125) Increase in creditors320,0942,626,499 Decrease/(Increase) in debtors271,55 1 2 12,85 1 (339,759) 635,6 15 3,022,532 1,982,433 APPLICATION OF FUNDS Purchase of fixed assets(1,424,617) ;i,426,644) Secured loan repayment(40,000) Taxation paid(14,680)(87,309) Dividends paid(84,058)(191,190) Less shares issued in lieu of dividend(84,058)8 1,184 (110,006) GAIN IN LIQUID FUNDS1,459,177358,474 CHANGES IN LIQUID FUNDS Increase in short term deposits1,781,452 167,164 (Increase)/decrease in net bank overdrafts and cash(322,275)19 1,3 10 1,459,177 358,474 HILLARDS LIMITED 17
Read by machine
STATEMENT OF SOURCE AND APPLICATION OF FUNDS
for the 53 weeks ended 1st May, 1976


                                                          52 weeks)
                                                    1976    1975
                                                                                              £
    FUNDS GENERATED FROM TRADING
    Group profit    before taxation                                 1,066,398                 640,824
    Extraordinary   item                                                                      (32,586)
    Depreciation                                                      216,411                 148,864
                                                                    1,282,809                   757,102

    FUNDS FROM     OTHER SOURCES
    Proceeds from   sale of fixed     assets        39,111                           19,658
    Placing  of shares for  cash                    509,614
    Secured  loan   receipts                        978,104                          570,027
    Share Option    Scheme                          43                               31
                                                                1,526,872                       589,716

                                                                2,809,681                     1,346,818

    CHANGES IN WORKING     CAPITAL
    (Increase)  in  stocks        (378,794)                                        (1,651,125)
    Increase in creditors                           320,094         2,626,499
        in     debtors                              271,551                          (339,759)
                                                                  212,851                       635,615

                                                                3,022,532                     1,982,433

    APPLICATION OF  FUNDS
    Purchase   of   fixed assets                                      (1,424,617)           (1,426,644)
    Secured  loan   repayment                                            (40,000)
    Taxation paid                                                        (14,680)              (87,309)
    Dividends   paid                                (84,058)                         (191,190)
    Less shares   issued    in  lieu of dividend                                     81,184
                                                                         (84,058)    ————.    (110,006)
    GAIN IN LIQUID     FUNDS                                    1,459,177                       358,474


    CHANGES IN LIQUID FUNDS

    Increase in short term deposits                 1,781,452                 167,164
    (Increase) /decrease in net bank overdrafts
    and cash                                                    (322,275)     191,310
                                                    1,459,177                 358,474


    HILLARDS
    LIMITED
STATEMENT OF SOURCE AND APPLICATION OF FUNDS for the 53 weeks ended 1st May, 1976 52 weeks) 1976 1975 £ FUNDS GENERATED FROM TRADING Group profit before taxation1,066,398640,824 Extraordinary item(32,586) Depreciation216,411148,864 1,282,809 757,102 FUNDS FROM OTHER SOURCES Proceeds from sale of fixed assets39,11119,658 Placing of shares for cash509,614 Secured loan receipts978,104570,027 Share Option Scheme 43 31 1,526,872 589,716 2,809,681 1,346,818 CHANGES IN WORKING CAPITAL (Increase) in stocks(378,794)(1,651,125) Increase in creditors320,0942,626,499 in debtors271,551(339,759) 212,851 635,615 3,022,532 1,982,433 APPLICATION OF FUNDS Purchase of fixed assets(1,424,617)(1,426,644) Secured loan repayment(40,000) Taxation paid(14,680)(87,309) Dividends paid(84,058)(191,190) Less shares issued in lieu of dividend81,184 (84,058) ----. (110,006) GAIN IN LIQUID FUNDS1,459,177358,474 CHANGES IN LIQUID FUNDS Increase in short term deposits1,781,452167,164 (Increase) /decrease in net bank overdrafts and cash(322,275)191,310 1,459,177 358,474 HILLARDS LIMITED
Read by machine, contrast corrected highest quality of the three
STATEMENT OF SOURCE AND APPLICATION OF FUNDS
for the 53 weeks ended 1st May, 1976


                                                          52 weeks)
                                                    1976    1975
                                                                                              £
    FUNDS GENERATED     FROM TRADING
    Group profit    before taxation                                 1,066,398                 640,824
    Extraordinary   item                                                                      (32,586)
    Depreciation                                                      216,411                 148,864
                                                                1,282,809                     757,102
    FUNDS FROM     OTHER SOURCES
    Proceeds from   sale of fixed     assets        39,111                           19,658
    Placing  of shares for  cash                    509,614
    Secured  loan   receipts                        978,104                          570,027
    Share Option    Scheme                          43                               31
                                                                1,526,872                     589,716

                                                                2,809,681                     1,346,818

    CHANGES IN WORKING CAPITAL
    (Increase)  in  stocks        (378,794)                                        (1,651,125)
    Increase in creditors                           320,094         2,626,499
        in             debtors                      271,551                          (339,759)
                                                                212,851                         635,615

                                                                3,022,532                     1,982,433

    APPLICATION OF  FUNDS
    Purchase   of   fixed assets                                      (1,424,617)           (1,426,644)
    Secured  loan   repayment                                            (40,000)
    Taxation paid                                                        (14,680)             (87,309)
    Dividends   paid                                (84,058)                         (191,190)
    Less shares   issued    in  lieu of dividend                                     81,184
                                                                         (84,058)    —        (110,006)

    GAIN IN LIQUID FUNDS                                        1,459,177                       358,474


    CHANGES IN LIQUID FUNDS

    Increase in short term deposits                 1,781,452                 167,164
    (Increase) /decrease in net bank overdrafts
    and cash                                                    (322,275)     191,310
                                                    1,459.1     77


    HILLARDS
    LIMITED


                                                                                              17
STATEMENT OF SOURCE AND APPLICATION OF FUNDS for the 53 weeks ended 1st May, 1976 52 weeks) 1976 1975 £ FUNDS GENERATED FROM TRADING Group profit before taxation1,066,398640,824 Extraordinary item(32,586) Depreciation216,411148,864 1,282,809 757,102 FUNDS FROM OTHER SOURCES Proceeds from sale of fixed assets39,11119,658 Placing of shares for cash509,614 Secured loan receipts978,104570,027 Share Option Scheme 43 31 1,526,872 589,716 2,809,681 1,346,818 CHANGES IN WORKING CAPITAL (Increase) in stocks(378,794)(1,651,125) Increase in creditors320,0942,626,499 in debtors271,551(339,759) 212,851 635,615 3,022,532 1,982,433 APPLICATION OF FUNDS Purchase of fixed assets(1,424,617)(1,426,644) Secured loan repayment(40,000) Taxation paid(14,680)(87,309) Dividends paid(84,058)(191,190) Less shares issued in lieu of dividend81,184 (84,058) - (110,006) GAIN IN LIQUID FUNDS1,459,177358,474 CHANGES IN LIQUID FUNDS Increase in short term deposits1,781,452167,164 (Increase) /decrease in net bank overdrafts and cash(322,275)191,310 1,459.1 77 HILLARDS LIMITED 17