Hillards Annual report and accounts 1974 page 22 of 24 previous next
Below is what the machine read from this scan, three times over. They are kept separate rather than merged: where they disagree, the disagreement is itself worth seeing, and a single tidy transcription would hide it.
The left column is raw output. The right is the same text after the repairs that make it searchable — joining letter-spaced words, mending split ones.
Text already in the scan
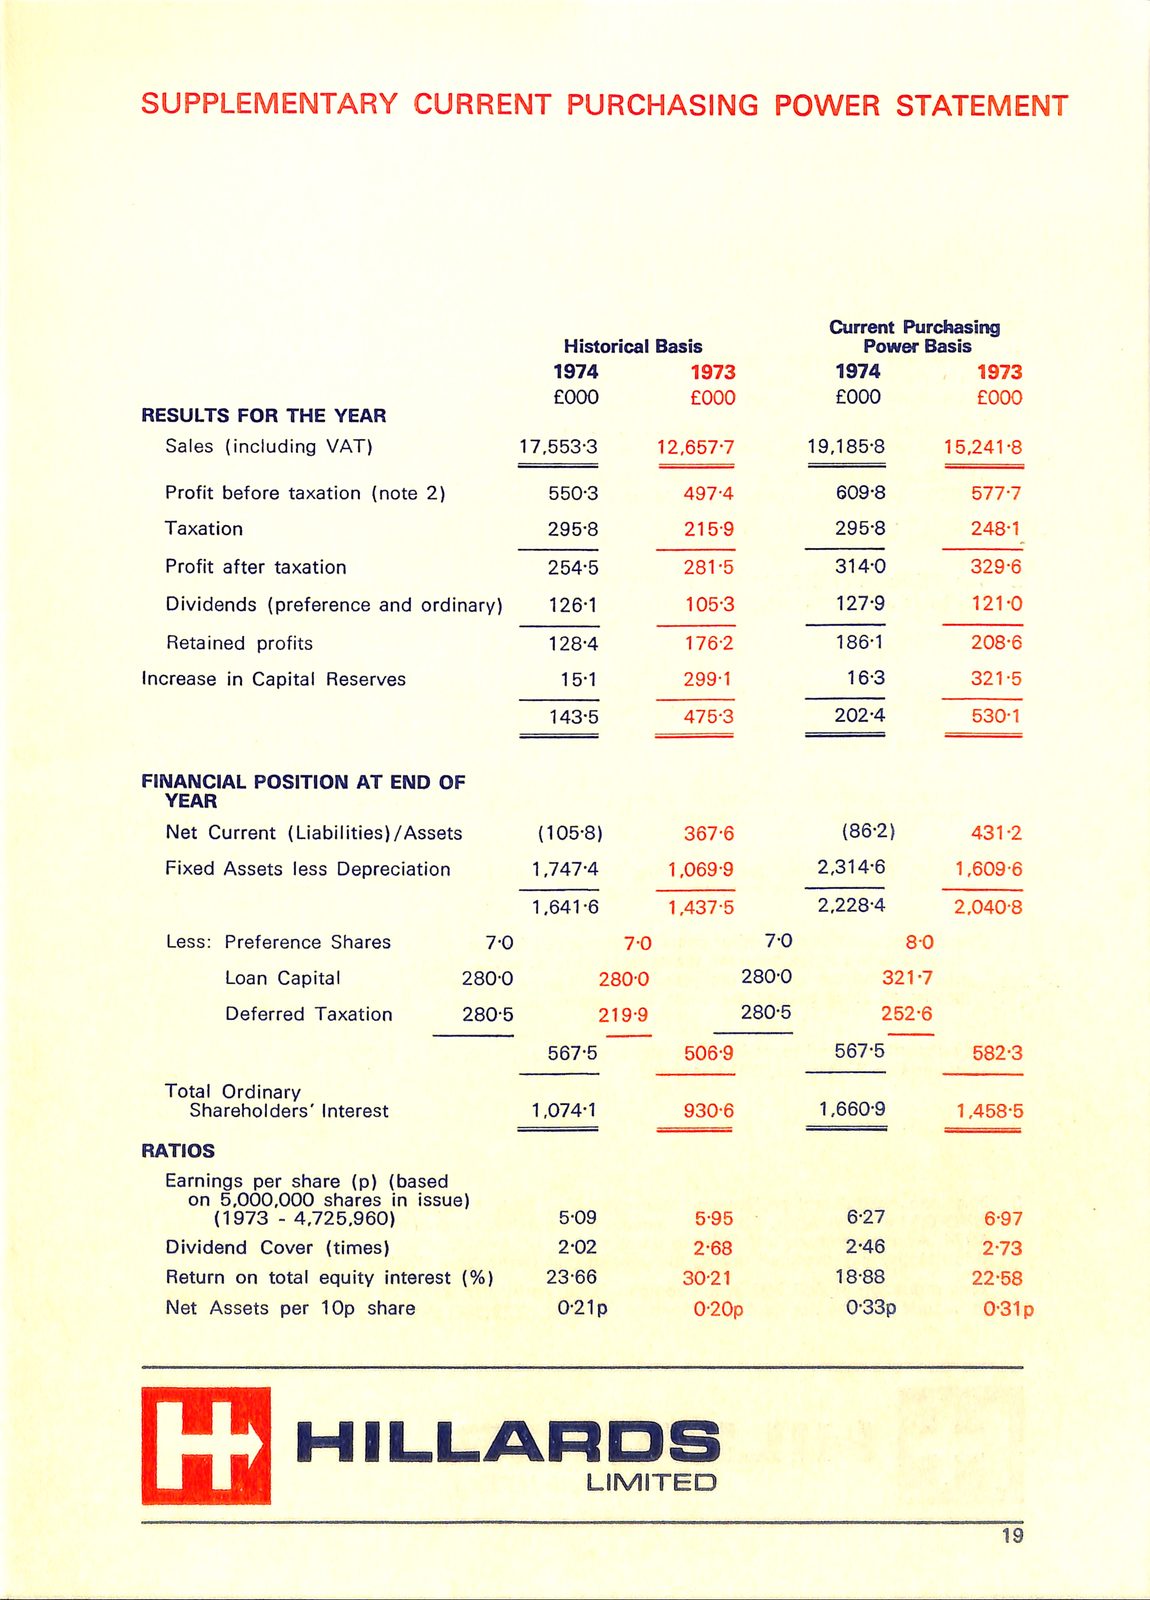
SUPPLEMENTARY CURRENT PURCHASING POWER STATEMENT


                                                            Current Purchasing
                                            Historical Basis    Power Basis
                                             1974           1973   1974          1973
                                             £000           £000   £000     £000
RESULTS FOR THE YEAR
Sales    (including VAT)                 17,553-3       12,657-7  19,185-8  15,24 1-8

Profit   before taxation    (note 2)        550-3   497-4          609-8     577-7

Taxation                                    295-8   2 15-9         295-8     248-1

Profit   after taxation                     254-5   28 1-5         3 14-0    329-6
Dividends     (preference and     ordinary) 126-1   105-3          127-9     12 1-0
Retained     profits                        128-4   176-2          186-1     208-6
Increase  in Capital    Reserves             15-1   299-1             16-3   32 1-5
                                            143-5   475-3          202-4     530-1


FINANCIAL POSITION AT END OF
YEAR
Net Current      (Liabilities)/Assets             (105-8)              367-6            (86-2)    43 1-2
Fixed  Assets  less Depreciation                  1,747-4        1,069-9                2,314-6  1,609-6
                                                  1,641-6        1,437-5                2,228-4  2,040-8
Less:  Preference    Shares                7-0               7-0                 7-0          8-0
       Loan  Capital                 280*0                   280-0             280-0       32 1-7
       Deferred    Taxation          280-5                   2 19-9            280-5        252-6
                                                      567-5            506-9              567-5    582-3
Total  Ordinary
     Shareholders' Interest                       1,074-1              930-6            1,660-9  1,458-5

RATIOS
Earnings per share     (p)     (based
  on   5,000,000   shares     in issue)
       (1973 - 4,725,960)                              5-09            5-95                6-27     6-97
Dividend    Cover   (times)                            2-02            2-68                2-46     2-73
Return   on total  equity  interest  (%)              23-66            30-2 1             18-88    22-58
Net Assets    per  lOp  share                     0-21 p               0-20p            0-33p    0-311


If       HILLARDS
                                                  LIMITED

                                                                                                 19
SUPPLEMENTARY CURRENT PURCHASING POWER STATEMENT Current Purchasing Historical Basis Power Basis 1974 1973 1974 1973 £000 £000 £000 £000 RESULTS FOR THE YEAR Sales (including VAT) 17,553-3 12,657-7 19,185-8 15,24 1-8 Profit before taxation (note2)550-3 497-4 609-8 577-7 Taxation295-82 15-9 295-8 248-1 Profit after taxation254-528 1-5 3 14-0 329-6 Dividends (preference and ordinary)126-1105-3 127-9 12 1-0 Retained profits128-4176-2 186-1 208-6 Increase in Capital Reserves15-1299-1 16-3 32 1-5 143-5 475-3 202-4 530-1 FINANCIAL POSITION AT END OF YEAR Net Current (Liabilities)/Assets (105-8) 367-6 (86-2) 43 1-2 Fixed Assets less Depreciation1,747-41,069-9 2,314-6 1,609-6 1,641-6 1,437-5 2,228-4 2,040-8 Less: Preference Shares7-07-0 7-0 8-0 Loan Capital280*0280-0 280-0 32 1-7 Deferred Taxation280-52 19-9 280-5 252-6 567-5 506-9 567-5 582-3 Total Ordinary Shareholders' Interest1,074-1930-6 1,660-9 1,458-5 RATIOS Earnings per share (p) (based on 5,000,000shares in issue) (1973 - 4,725,960) 5-09 5-95 6-27 6-97 Dividend Cover (times)2-022-68 2-46 2-73 Return on total equity interest(%)23-66 30-2 1 18-88 22-58 Net Assets per lOp share0-21 p 0-20p 0-33p 0-311 If HILLARDS LIMITED 19
Read by machine highest quality of the three
SUPPLEMENTARY CURRENT PURCHASING POWER STATEMENT


                                                         Current           Purchasing
                                              Historical Basis         Power Basis
                                             1974    1973              1974           1973
RESULTS FOR THE YEAR                         £000    £000              £000           £000
Sales    (including VAT)    17,553°3                      12,657°7      19,185°8  15,241°8

Profit   before taxation    (note 2           550°3          497°4     609°8         577-7

Taxation                                                     215°9     295°8

Profit   after taxation                                      281°5     314-0         329°6

Dividends     (preference and     ordinary)   126°1          105°3     127°9         121-0

Retained    profits                                          176:2     186°1         208°6
Increase in Capital    Reserves                              299°1          16:3     321°5

                                                             475°3     202°4         530°1


FINANCIAL POSITION AT END OF
YEAR
Net Current     (Liabilities) /Assets          (105°8)              367°6             (86-2)     431-2
Fixed  Assets less Depreciation                    1,747°4        1,069°9

                                                   1,641°6        1,437°5             2,228°4  2,040°8

Less:  Preference  Shares               7:0        7:0                       70             8-0

       Loan Capital                                      280:0               280:0

       Deferred  Taxation             280°5              219-9               280°5        252°6

                                                     567°5                              567°5    582°3

Total  Ordinary
Shareholders’ Interest                         1,074°1              930°6             1,660°9  1,458°5

RATIOS

Earnings  per share    (p) (based
    on 5,000,000  shares     in issue)
    1973    - 4,725,960                             5:09             5:95                6:27     6:97
Dividend  Cover     (times)                           2:02           2°68                2°46      273
Return on   total equity   interest    (%)         23°66          30°21                 18°88    22°58
Net Assets  per   10p  share                                      0:20p


       HILLARDS
                                               LIMITED

                                               SSS                =                   =        =
SUPPLEMENTARY CURRENT PURCHASING POWER STATEMENT Current Purchasing Historical Basis Power Basis 1974 1973 1974 1973 RESULTS FOR THE YEAR£000£000 £000 £000 Sales (including VAT) 17,553°3 12,657°7 19,185°8 15,241°8 Profit before taxation (note2550°3 497°4 609°8 577-7 Taxation215°9295°8 Profit after taxation281°5314-0 329°6 Dividends (preference and ordinary)126°1105°3 127°9 121-0 Retained profits176:2186°1 208°6 Increase in Capital Reserves299°116:3 321°5 475°3 202°4 530°1 FINANCIAL POSITION AT END OF YEAR Net Current (Liabilities) /Assets(105°8)367°6 (86-2) 431-2 Fixed Assets less Depreciation1,747°41,069°9 1,641°6 1,437°5 2,228°4 2,040°8 Less: Preference Shares7:07:0 70 8-0 Loan Capital280:0280:0 Deferred Taxation280°5219-9 280°5 252°6 567°5 567°5 582°3 Total Ordinary Shareholders' Interest1,074°1930°6 1,660°9 1,458°5 RATIOS Earnings per share (p) (based on 5,000,000shares in issue) 1973 - 4,725,960 5:09 5:95 6:27 6:97 Dividend Cover (times)2:022°68 2°46 273 Return on total equity interest(%)23°66 30°21 18°88 22°58 Net Assets per 10p share 0:20p HILLARDS LIMITED SSS = = =
Read by machine, contrast corrected
SUPPLEMENTARY CURRENT PURCHASING POWER STATEMENT


                                                         Current Purchasing
                                              Historical Basis        Power Basis
                                             1974    1973             1974        1973
RESULTS FOR THE YEAR                         £000    £000             £000        £000
Sales    (including VAT)    17,553°3                      12,657°7  19,185°8  15,241°8

Profit   before taxation    (note 2           550°3          497°4    609°8

Taxation                                                              295°8      248°1
Profit   after taxation                       254°5          281°5    314°0      329°6

Dividends     (preference and     ordinary)   126°1          105°3    127°9      121:0

Retained    profits                           128°4          176:2               208°6
Increase in Capital    Reserves               1571           299°1      16:3     321°5

                                                             475°3    202°4      530°1


FINANCIAL POSITION AT END OF
YEAR
Net Current     (Liabilities) /Assets        (105-8)        367°6             (86-2)       431-2
Fixed  Assets less Depreciation              1,747°4      1,069°9                        1,609°6

                                             1,641°6      1,437°5             2,228°4    2,040°8

Less:  Preference  Shares        7:0                                 70

       Loan Capital                              280:0               280:0     321°7

       Deferred  Taxation                        219-9               280°5     252°6

                                             567°5          506'9               567°5      582°3

Total  Ordinary
Shareholders’ Interest                                      930°6             1,660°9    1,458°5

RATIOS

Earnings  per share    (p) (based
    on 5,000,000  shares     in issue)
    1973    - 4,725,960                       5:09           5:95                6:27       6:97
Dividend  Cover     (times)                   2:02           2°68                2°46       2°73
Return on   total equity   interest    (%)   23°66                              18°88      22°58  30°21
Net Assets  per   10p  share               O-21p          0:20p


       HILLARDS
                                              LIMITED

       oe                                     aaa         =          =        —
SUPPLEMENTARY CURRENT PURCHASING POWER STATEMENT Current Purchasing Historical Basis Power Basis 1974 1973 1974 1973 RESULTS FOR THE YEAR£000£000 £000 £000 Sales (including VAT) 17,553°3 12,657°7 19,185°8 15,241°8 Profit before taxation (note2550°3 497°4 609°8 Taxation295°8248°1 Profit after taxation254°5281°5 314°0 329°6 Dividends (preference and ordinary)126°1105°3 127°9 121:0 Retained profits128°4176:2 208°6 Increase in Capital Reserves1571299°1 16:3 321°5 475°3 202°4 530°1 FINANCIAL POSITION AT END OF YEAR Net Current (Liabilities) /Assets(105-8)367°6 (86-2) 431-2 Fixed Assets less Depreciation1,747°41,069°9 1,609°6 1,641°6 1,437°5 2,228°4 2,040°8 Less: Preference Shares7:070 Loan Capital280:0280:0 321°7 Deferred Taxation219-9280°5 252°6 567°5 506'9 567°5 582°3 Total Ordinary Shareholders' Interest930°61,660°9 1,458°5 RATIOS Earnings per share (p) (based on 5,000,000shares in issue) 1973 - 4,725,960 5:09 5:95 6:27 6:97 Dividend Cover (times)2:022°68 2°46 2°73 Return on total equity interest(%)23°66 18°88 22°58 30°21 Net Assets per 10p share O-21p 0:20p HILLARDS LIMITED oe aaa = = -