Hillards Annual report and accounts 1986 page 8 of 28 previous next
Below is what the machine read from this scan, three times over. They are kept separate rather than merged: where they disagree, the disagreement is itself worth seeing, and a single tidy transcription would hide it.
The left column is raw output. The right is the same text after the repairs that make it searchable — joining letter-spaced words, mending split ones.
Text already in the scan
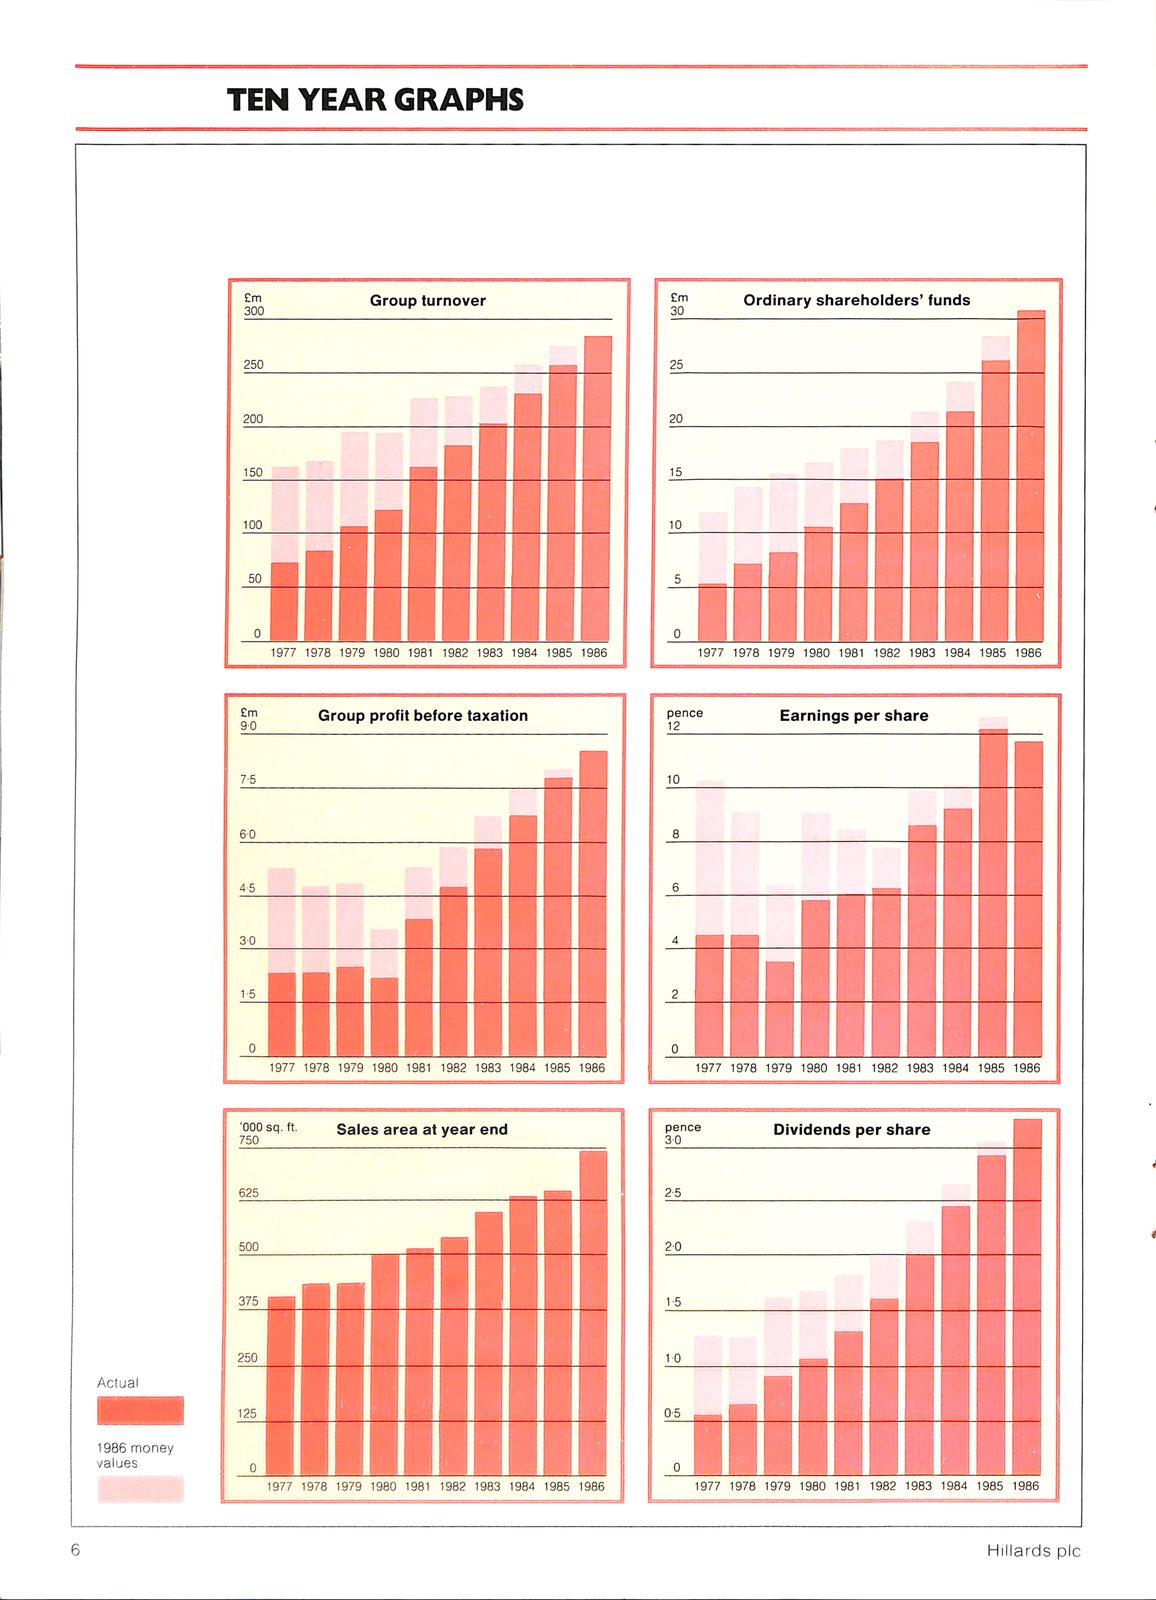
TEN YEAR GRAPHS


Group turnover     £m  Ordinary sfiarefioiders' funds
300                30


25


20


15


10


1977 1978 1979 1980 1981 1982 1983 1984 1985 1986  1977 1978 1979 1980 1981 1982 1983 1984 1985 1986


Group profit before taxation     pence    Earnings per sfiare
90                               12


7'5                              10


60


4-5


30


1-5


1977 1978 1979 1980 1981 1982 1983 1984 1985 1986  1977 1978 1979 1980 1981 1982 1983 1984 1985 1986


•000   sq. ft.    Sales area at year end    pence    Dividends persfiare    ||H
750        '        I                                                        ll
                                                                           .ilH
                                                               •••••


Actual


1986 money
values
    1977  1978 1979 1980 1981 1982 1983 1984 1985 1986  1977 1978 1979 1980 1981 1982 1983 1984 1985 1986


                                                               Hillards pic
TEN YEAR GRAPHS Group turnover £m Ordinary sfiarefioiders' funds 300 30 25 20 15 10 1977 1978 1979 1980 1981 1982 1983 1984 1985 1986 1977 1978 1979 1980 1981 1982 1983 1984 1985 1986 Group profit before taxation pence Earnings per sfiare 90 12 7'5 10 60 4-5 30 1-5 1977 1978 1979 1980 1981 1982 1983 1984 1985 1986 1977 1978 1979 1980 1981 1982 1983 1984 1985 1986 •000 sq. ft. Sales area at year end pence Dividends persfiare ||H 750 ' I ll .ilH ••••• Actual 1986money values 1977 1978 1979 1980 1981 1982 1983 1984 1985 1986 1977 1978 1979 1980 1981 1982 1983 1984 1985 1986 Hillards pic
Read by machine highest quality of the three
TEN YEAR GRAPHS


Group turnover    Ordinary shareholders’ funds


1977 1978 1979 1980 1981 1982 1983 1984 1985 1986


Earnings per share


1977 1978 1979 1980 1981 1982 1983 1984 1985 1986  1977 1978 1979 1980 1981 1982 1983 1984 1985 1986


‘000 sq. ft.    Sales area at year end    Dividends per share
750


Actual


1986 money
values

    1977  1978 1979 1980 1981 1982 1983 1984 1985 1986


Hillards ple
TEN YEAR GRAPHS Group turnover Ordinary shareholders' funds 1977 1978 1979 1980 1981 1982 1983 1984 1985 1986 Earnings per share 1977 1978 1979 1980 1981 1982 1983 1984 1985 1986 1977 1978 1979 1980 1981 1982 1983 1984 1985 1986 '000 sq. ft. Sales area at year end Dividends per share 750 Actual 1986money values 1977 1978 1979 1980 1981 1982 1983 1984 1985 1986 Hillards ple
Read by machine, contrast corrected
TEN YEAR GRAPHS


Group turnover    Ordinary shareholders’ funds


1977 1978 1979 1980 1981 1982 1983 1984 1985 1986


Earnings per share


1977 1978 1979 1980 1981 1982 1983 1984 1985 1986  1977 1978 1979 1980 1981 1982 1983 1984 1985 1986


‘000 sq. ft.    Sales area at year end    Dividends per share
750


Actual


1986 money
values

    1977  1978 1979 1980 1981 1982 1983 1984 1985 1986
    =


Hillards ple
TEN YEAR GRAPHS Group turnover Ordinary shareholders' funds 1977 1978 1979 1980 1981 1982 1983 1984 1985 1986 Earnings per share 1977 1978 1979 1980 1981 1982 1983 1984 1985 1986 1977 1978 1979 1980 1981 1982 1983 1984 1985 1986 '000 sq. ft. Sales area at year end Dividends per share 750 Actual 1986money values 1977 1978 1979 1980 1981 1982 1983 1984 1985 1986 = Hillards ple