Hillards Annual report and accounts 1984 page 27 of 28 previous next
Below is what the machine read from this scan, three times over. They are kept separate rather than merged: where they disagree, the disagreement is itself worth seeing, and a single tidy transcription would hide it.
The left column is raw output. The right is the same text after the repairs that make it searchable — joining letter-spaced words, mending split ones.
Text already in the scan
    HILLARDS pic


    Ten year record


                                               1984       1983         1982       1981       1980           1979"o         1978         1977      1976       1975
                                               £000       £000         £000       £000       £000     £000O"               £000         £000      £000       £000
                                                                                                        CO
    Group turnover (including VAT)          233,404    204,259      183,761    162,821    119,428        103,759         82,904      7 1,030    54,980     35,565CO

    Group profit before employee
    profit share and taxation                 7,092      5,811        4,780      3,838      2,231          2,537          2,311        2,309     1,066       64 1
    Employee profit share                       335          -            -          -      -                  -      -        -    -                           -
    Group profit before taxation              6,757      5,811        4,780      3,838      2,231          2,537          2,311        2,309     1,066       64 1
    Taxation                                  2,307      1,695        1,780        936    (495)              966            206         2 18       199    (7)
    Extraordinary items                           -     -    -    -                         -                 69          -    -    -                          33
    Dividends                                 1,178        977          792        639        509           4 10            287          256       224        139

    Retained profit                           3,272      3,139        2,208      2,263      2,217          1,092          1,818        1,835       643        476
    Increase in ordinary share capital
    and reserves                                 78         55           35        124        135             27              7    -              5 10         85

    Increase in ordinary
    shareholders'funds                        3,350      3,194        2,243      2,387      2,352          1,119          1,825        1,835     1,153        561

    Tangible fixed assets                    41,141     34,411       25,616     22,302     17,799         11,396          7,435        5,035     4,179      3,009
    Unlisted investment                           -          -           45         45          -                            --                     --     -
    Net current assets/(liabilities)    (14,600)      (13,095)     (7,465)     (6,044)     (3,114)         1,032          1,865        2,062       968     (20)
    Creditors due after one year            (4,904)     (3,029)    (3,103)     (3,453)     (4,222)    (4,317)    (2,308)    (1,930)                         (810)  (1,815)

    Shareholders' funds                      21,637    18,287        15,093     12,850     10,463          8,111          6,992        5,167     3,332      2,179
    Preference shares                             7          7            7          7          7              7              7        7             7          7

    Ordinary shareholders' funds            2 1,630    18,280        15,086     12,843     10,456          8,104          6,985        5,160     3,325      2,172

    Earnings per lOp ordinary share          18-20p     16-90p       12-34p     12-06p     ll-46p          6-72p          9-05p        9-Olp     4-lOp      3-21p
    Dividends per lOp ordinary share          4-80p     4-OOp         3-25p      2-63p      2-13p          l-75p          l-23p          MOp     0-99p      0-68p
    Net assets per lOp ordinary share           88p        75p          62p        53p        44p            35p            30p          22p       16p        lip
    Profit before taxation as %   of
    group turnover (including VAT)          2-89°/o      2-84%        2-60%     2-36°o      1-87%         2-45°o         2-79°o      3-25° 0    l-94°o    l-80°/o
    Return of profit before taxation on
    ordinary shareholders' funds             3 1-2%     3 1-8%     3 1-7° 0     29-9°o     2 1-3%                         33-1%       44-8°o    32-l°o     29-5°o
    Sales area at year end (000 sq. ft.)        634        593          533      5 1 1        495            432            432          394       396        370
    Sales area weighted average
    through year (000 sq. ft.)                  605        546          522       5 15        445            474            420          395       390        300
    Average sales per sq. ft. per week        £7-42      £7-19        £6-77      £5-97      £5-16          £4-21          £3-80        £3-46     £2-66     £2-28
    Number of stores at year end:
    Over 20,000 sq. ft.                          13         11           10         10          9              7              7        6             6          5
    10,000-20,000 sq. ft.                        15    15                13         12         12             11             11           10        10         10
Other self-service stores                        13         16           16         17         19             24             25           25        27         28
    Number of employees:
    full-time (average through year)          2,573      2,516        2,458      2,211      1,890          1,963          1,896        1,782     1,663      1,308
    part-time (average through year)          2,757      2,064        1,769      1,484      1,319          1,146          1,058        1,040     1,077     777


    1981 and earlier years have been adjusted to reflect capitalisation issues.


                                            Printed by Watmoughs Limited, Idle, Bradford; and London                                                       25
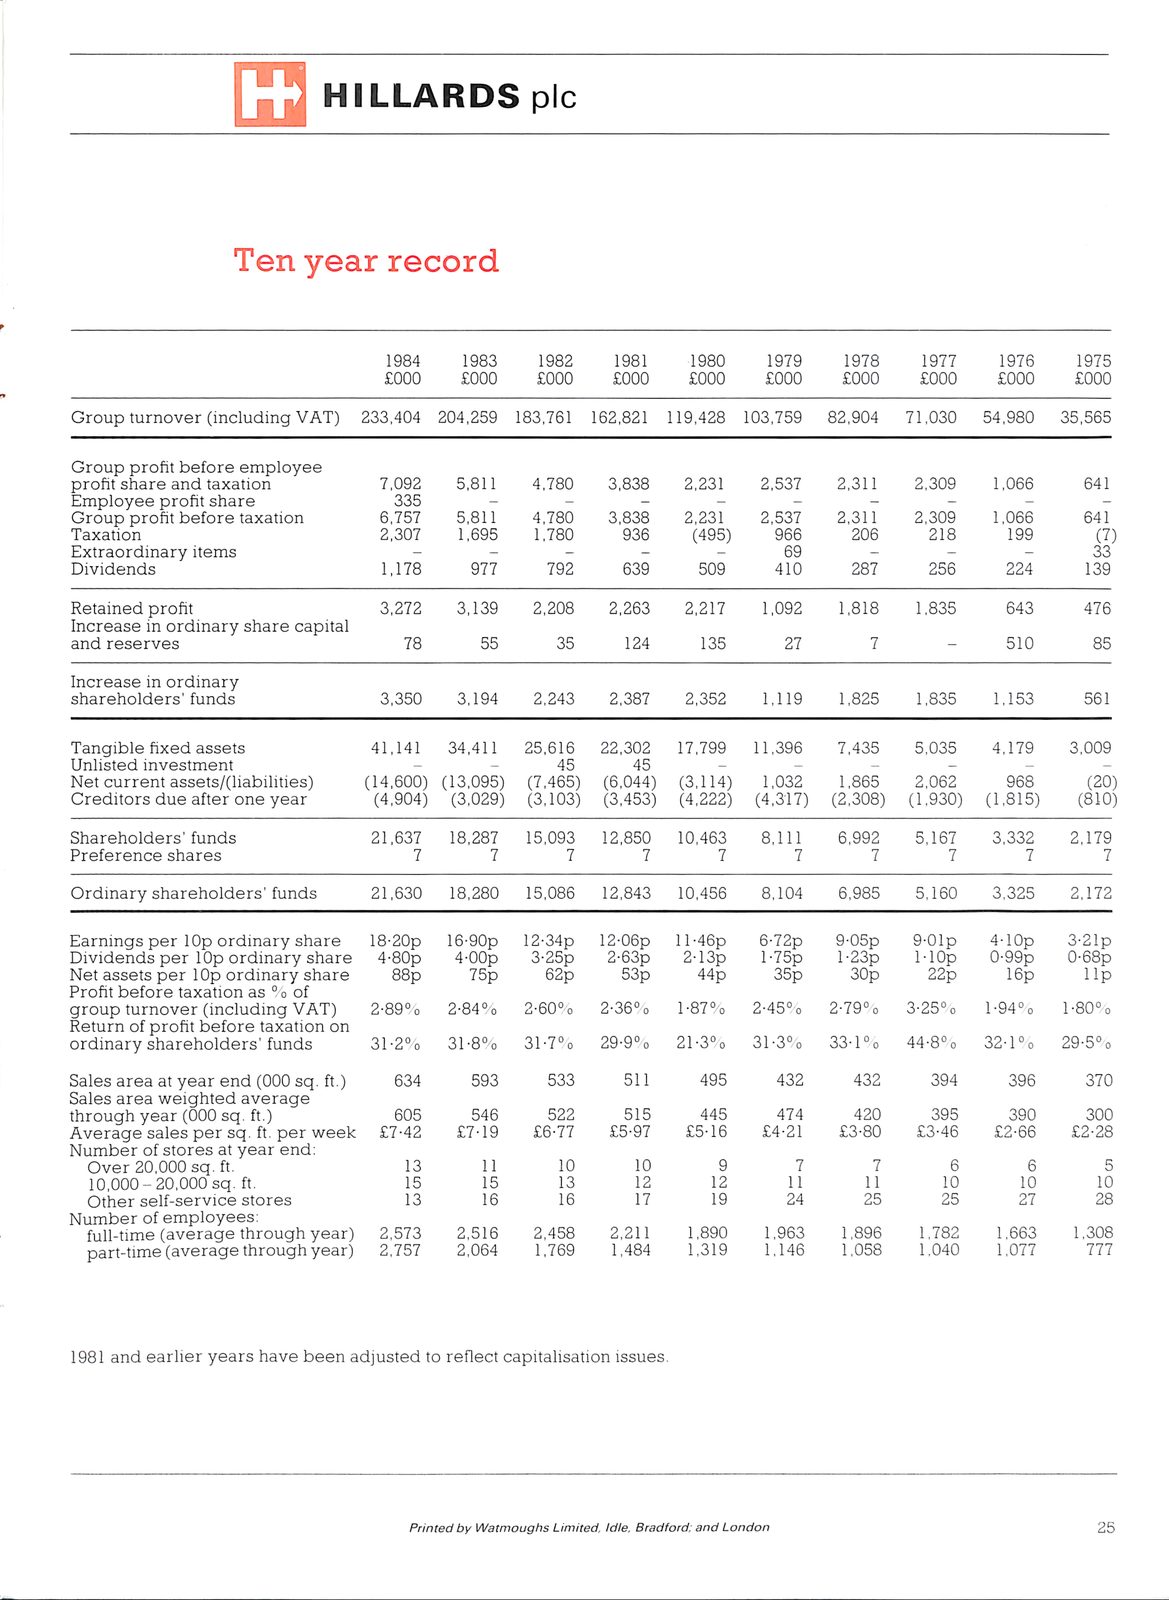
HILLARDS pic Ten year record 1984 1983 1982 1981 1980 1979"o 1978 1977 1976 1975 £000 £000 £000 £000 £000 £000O" £000 £000 £000 £000 CO Group turnover (including VAT) 233,404 204,259 183,761 162,821 119,428 103,759 82,904 7 1,030 54,980 35,565CO Group profit before employee profit share and taxation7,0925,811 4,780 3,838 2,231 2,537 2,311 2,309 1,066 64 1 Employee profit share335- - - - - - - - - Group profit before taxation6,7575,811 4,780 3,838 2,231 2,537 2,311 2,309 1,066 64 1 Taxation2,3071,695 1,780 936 (495) 966 206 2 18 199 (7) Extraordinary items - - - - - 69 - - - 33 Dividends1,178977 792 639 509 4 10 287 256 224 139 Retained profit3,2723,139 2,208 2,263 2,217 1,092 1,818 1,835 643 476 Increase in ordinary share capital and reserves 78 55 35 124 135 27 7 - 5 10 85 Increase in ordinary shareholders'funds 3,350 3,194 2,243 2,387 2,352 1,119 1,825 1,835 1,153 561 Tangible fixed assets41,14134,411 25,616 22,302 17,799 11,396 7,435 5,035 4,179 3,009 Unlisted investment - - 45 45 - -- -- - Net current assets/(liabilities) (14,600) (13,095) (7,465) (6,044) (3,114) 1,032 1,865 2,062 968 (20) Creditors due after one year(4,904)(3,029) (3,103) (3,453) (4,222) (4,317) (2,308) (1,930) (810) (1,815) Shareholders' funds21,63718,287 15,093 12,850 10,463 8,111 6,992 5,167 3,332 2,179 Preference shares7777777777 Ordinary shareholders' funds21,630 18,280 15,086 12,843 10,456 8,104 6,985 5,160 3,325 2,172 Earnings per lOp ordinary share 18-20p 16-90p 12-34p 12-06p ll-46p 6-72p 9-05p 9-Olp 4-lOp 3-21p Dividends per lOp ordinary share 4-80p4-OOp 3-25p 2-63p 2-13p l-75p l-23p MOp 0-99p 0-68p Net assets per lOp ordinary share 88p 75p 62p 53p 44p 35p 30p 22p 16p lip Profit before taxation as % of group turnover (including VAT) 2-89°/o 2-84% 2-60% 2-36°o 1-87% 2-45°o 2-79°o 3-25° 0 l-94°o l-80°/o Return of profit before taxation on ordinary shareholders' funds31-2% 3 1-8% 3 1-7° 0 29-9°o 2 1-3% 33-1% 44-8°o 32-l°o 29-5°o Sales area at year end (000 sq. ft.) 634 593 533 511 495 432 432 394 396 370 Sales area weighted average through year(000 sq. ft.) 605 546 522 5 15 445 474 420 395 390 300 Average sales per sq. ft. per week£7-42£7-19 £6-77 £5-97 £5-16 £4-21 £3-80 £3-46 £2-66 £2-28 Number of stores at year end: Over20,000 sq. ft. 13 11 10 10 977665 10,000-20,000 sq. ft. 15 15 13 12 12 11 11 10 10 10 Other self-service stores 13 16 16 17 19 24 25 25 27 28 Number of employees: full-time (average through year)2,5732,516 2,458 2,211 1,890 1,963 1,896 1,782 1,663 1,308 part-time (average through year)2,7572,064 1,769 1,484 1,319 1,146 1,058 1,040 1,077 777 1981 and earlier years have been adjusted to reflect capitalisation issues. Printed by Watmoughs Limited, Idle, Bradford; and London 25
Read by machine highest quality of the three
    HILLARDS plc


    Ten year record


                                           1984          1983         1982       1981                  1980     1979      1978      1977    1976        1975
                                           £000          £000         £000       £000              £000         £000      £000      £000      £000      £000

    Group turnover     (including VAT)  233,404       204,259      183,761    162,821           119,428      103,759    82,904    71,030    54,980    35,565

    Group profit before employee
    profit share and taxation             7,092     5,811            4,780          3,838     2,231            2,537     2,311     2,309     1,066     641
    Employee profit share                   335                 =                       =                 —        =         -         -         -         -
    Group profit before taxation          6,757     5,811            4,780          3,838     2,231            2,537     2,311     2,309     1,066     641
    Taxation                              2,307     1,695            1,780            936    (495)               966       206       218       199     (7)
    Extraordinary items                       -                          -              -                 ~       69         -                   —        33
    Dividends                             1,178               977      792            639               509      410       287       256       224       139

    Retained profit                       3,272     3,139            2,208          2,263     2,217            1,092     1,818     1,835       643       476
    Increase in ordinary share capital
    and reserves                             78                55       35            124               135       27         7                 510        85

    Increase in ordinary
    shareholders’ funds                   3,350     3,194            2,243          2,387             2,352    1,119     1,825     1,835     1,153     561


    Tangible fixed   assets                              41,141         34,411         25616     22,302      17,799         11,396    7,435        5,035     4,179        3,009
    Unlisted investment                                                      ~            45      45                  -                                -         -            ~
    Net current  assets/(liabilities)  (14,600) (13,095)                              (7,465)     (6,044)     (3,114)     —  1,032    1,865        2,062       968         (20)
    Creditors due after     one year                        (4,904)     (3,029)       (3,103)     (8,453)     (4,222)     (4,317)    (2,308)    (1,930)    (1,815)        (810)

    Shareholders’ funds                                  21,637         18,287        15,093     12,850          10,463      8,111    6,992        5,167     3,332        2,179
    Preference shares                                         7              7             7      7               7              7        7            7         7            7

    Ordinary shareholders’ funds                         21,630         18,280        15,086     12,843          10,456    8,104      6,985        5,160         3,325    2,172

    Earnings per 1Opordinary share                       18-20p                                  12-06p      11-46p          6-72p    9-05p        9-Olp     4-10p        3-21p
    Dividends    per 10p ordinary share                   4-80p          4-00p         3-25p      2-63p       2:13p          1-75p    1-23p        1-10p     0-99p        0-68p
    Net assets   per               10p ordinary share       88p            75p           62p        53p         44p            35p      30p          22p       16p          llp
    Profit before taxation      as     °%  of
    group turnover (including VAT)                                                     2:60%      2:36%       1:87%                   2:79%        3:25%     1:94%        1-80%
    Return of profit before taxation               on
    ordinary shareholders’ funds                          31:2%          31:8%                                21:3%          31:3%    33:1%        44-8%                   295%

    Sales  area  at year end 000     sq.     ft.)           634            593           533        511             495        432      432          394           396      370
    Sales  area  weighted       average
    through year 000     sq.    ft.)                        605            546           522        515             445        474          420     395            390      300
    Average sales    per sq.        ft.                   £7-42              £7-19     £6-77      £5-97           £5-16      £4-21    £3-80        £3-46         £2-66    £2-28
    Number of stores at         year     end:
    Over 20,000      sq. ft.                                 13              1            10     10                   9     7             7         6                6        5
    10,000   —   20,000  sq.    ft.                          15             15            13         12              12          1       ll         10              10       10
    Other   self-service stores                              13             16            16         17              19     24               25     25              27       28
    Number of    employees:
    full-time (average          through year)             2,573              2,516     2,458      2,211           1,890     1,963         1,896     1,782        1,663    1,308
    part-time (average          through year)             2,757          2,064         1,769      1,484           1,319     1,146         1,058     1,040        1,077      TTT


1981 and earlier years have been adjusted to reflect capitalisation issues.


                                                         Printed by Watmoughs Limited, Idle, Bradford; and London                                                         25
HILLARDS plc Ten year record 1984 1983 1982 1981 1980 1979 1978 1977 1976 1975 £000 £000 £000 £000 £000 £000 £000 £000 £000 £000 Group turnover (including VAT) 233,404 204,259 183,761 162,821 119,428 103,759 82,904 71,030 54,980 35,565 Group profit before employee profit share and taxation7,0925,811 4,780 3,838 2,231 2,537 2,311 2,309 1,066 641 Employee profit share335= = - = - - - - Group profit before taxation6,7575,811 4,780 3,838 2,231 2,537 2,311 2,309 1,066 641 Taxation2,3071,695 1,780 936 (495) 966 206 218 199 (7) Extraordinary items - - - ~ 69 - - 33 Dividends1,178977 792 639 509 410 287 256 224 139 Retained profit3,2723,139 2,208 2,263 2,217 1,092 1,818 1,835 643 476 Increase in ordinary share capital and reserves 78 55 35 124 135 27 7 510 85 Increase in ordinary shareholders' funds3,3503,194 2,243 2,387 2,352 1,119 1,825 1,835 1,153 561 Tangible fixed assets41,14134,411 25616 22,302 17,799 11,396 7,435 5,035 4,179 3,009 Unlisted investment ~ 45 45 - - - ~ Net current assets/(liabilities) (14,600) (13,095) (7,465) (6,044) (3,114) - 1,032 1,865 2,062 968 (20) Creditors due after one year(4,904)(3,029) (3,103) (8,453) (4,222) (4,317) (2,308) (1,930) (1,815) (810) Shareholders' funds21,63718,287 15,093 12,850 10,463 8,111 6,992 5,167 3,332 2,179 Preference shares7777777777 Ordinary shareholders' funds21,63018,280 15,086 12,843 10,456 8,104 6,985 5,160 3,325 2,172 Earnings per 1Opordinary share 18-20p 12-06p 11-46p 6-72p 9-05p 9-Olp 4-10p 3-21p Dividends per 10p ordinary share 4-80p 4-00p 3-25p 2-63p 2:13p 1-75p 1-23p 1-10p 0-99p 0-68p Net assets per 10p ordinary share 88p 75p 62p 53p 44p 35p 30p 22p 16p llp Profit before taxation as °% of group turnover (including VAT) 2:60% 2:36% 1:87% 2:79% 3:25% 1:94% 1-80% Return of profit before taxation on ordinary shareholders' funds31:2%31:8% 21:3% 31:3% 33:1% 44-8% 295% Sales area at year end 000 sq. ft.) 634 593 533 511 495 432 432 394 396 370 Sales area weighted average through year000 sq. ft.) 605 546 522 515 445 474 420 395 390 300 Average sales per sq. ft. £7-42 £7-19 £6-77 £5-97 £5-16 £4-21 £3-80 £3-46 £2-66 £2-28 Number of stores at year end: Over20,000 sq. ft. 13 1 10 10 977665 10,000 - 20,000 sq. ft. 15 15 13 12 12 1 ll 10 10 10 Other self-service stores 13 16 16 17 19 24 25 25 27 28 Number of employees: full-time (average through year)2,5732,516 2,458 2,211 1,890 1,963 1,896 1,782 1,663 1,308 part-time (average through year)2,7572,064 1,769 1,484 1,319 1,146 1,058 1,040 1,077 TTT 1981 and earlier years have been adjusted to reflect capitalisation issues. Printed by Watmoughs Limited, Idle, Bradford; and London 25
Read by machine, contrast corrected
    HILLARDS plc


    Ten year record


                                           1984              1983     1982       1981                  1980     1979      1978      1977    1976        1975
                                           £000          £000         £000       £000              £000         £000      £000      £000      £000      £000

    Group turnover     (including VAT)  233,404       204,259      183,761    162,821           119,428      103,759    82,904    71,030    54,980    35,565

    Group profit before employee
    profit share and taxation             7,092     5,811            4,780          3,838     2,231            2,537     2,311     2,309     1,066     641
    Employee profit share                   335                 -        =              -                          ~         -         -         -
    Group profit before taxation          6,757     5,811            4,780          3,838     2,231            2,537     2,311     2,309     1,066     641
    Taxation                              2,307             1,695    1,780            936    (495)               966       206       218       199     (7)
    Extraordinary items                       -                 -        -                                ~       69                   -         —        33
    Dividends                             1,178               977      792            639               509      410       287       256       224     139

    Retained profit                       3,272             3,139    2,208          2,263     2,217            1,092     1,818     1,835       643     476
    Increase in ordinary share capital
    and reserves                             78                55       35            124               135       27         7                 510        85

    Increase in ordinary
    shareholders’ funds                   3,350             3,194    2,243          2,387     2,352            1,119     1,825     1,835     1,153     561


    Tangible fixed assets                              41,141         34,411         25616     22,302        17,799        11,396        7,435         5,035        4,179        3,009
    Unlisted investment                                                    =            45             45             =         =            =             =            =            _
    Net current assets/(liabilities)  (14,600) (13,095)                             (7,465)     (6,044)      (3,114)        1,032        1,865         2,062          968        (20)
    Creditors due after     one year                      (4,904)     (3,029)       (3,103)     (3,453)      (4,222)    (4,317)    (2,308)    (1,930)    (1,815)                 (810)

    Shareholders’ funds                                21,637         18,287        15,093     12,850            10,463     8,111        6,992         5,167        3,332        2,179
    Preference shares                                       7              7             7              7             7         7            7             7            7            7

    Ordinary shareholders’ funds                       21,630         18,280        15,086     12,843            10,456     8,104        6,985         5,160        3,325        2,172

    Earnings per        share                          18-20p                                  12-06p        11-46p         6-72p        9-05p        9-O0lp        4-10p        3-21p
    Dividends   per        share                        4-80p          4-00p         3-25p      2-63p         2:13p         1-75p        1-23p         1-10p        0-99p        0-68p
    Net assets  per              10p ordinary share       88p            75p           62p        53p           44p           35p          30p           22p          16p          llp
    Profit before taxation     as     % of
    group turnover (including VAT)                                                   2:60%      2:36%         1:87%                      2:79%         3:25%        1:94%        1-80%
    Return of profit before taxation             on
    ordinary shareholders’ funds                                                                29:9%        21:°3%         31:3%        33:1%         44:8%        32:1%        29-5%

    Sales  area at year  end 000     sq.   ft.)           634            593           533        $11               495       432          432           394              396      370
    Sales  area    weighted    average
    through year    000  sq.   ft.)                       605            546           522        515               445       474              420           395          390      300
    Average sales     per sq.  ft.     per week         £7-42              £7-19     £6-77      £5-97             £5-16     £4-21        £3-80         £3-46            £2-66    £2-28
    Number of stores at     year     end:
    Over 20,000     sq. ft.                                13              1            10             10             9             7            7             6            6        5
             —  20,000  sq.    ft.                         15             15            13             12            12         1            1                10           10       10
                     10,000
    Other   self-service stores                            13             16            16         17                19            24           25            25           27       28
    Number of   employees:
         full-time (average    through year)            2,573              2,516     2,458      2,211             1,890         1,963        1,896         1,782        1,663    1,308
         part-time (average    through year)            2,757          2,064         1,769      1,484             1,319         1,146        1,058         1,040        1,077


1981 and earlier years have been adjusted to reflect capitalisation issues.


                                                       Printed by Watmoughs Limited, Idle, Bradford; and London                                                                  25
HILLARDS plc Ten year record 1984 1983 1982 1981 1980 1979 1978 1977 1976 1975 £000 £000 £000 £000 £000 £000 £000 £000 £000 £000 Group turnover (including VAT) 233,404 204,259 183,761 162,821 119,428 103,759 82,904 71,030 54,980 35,565 Group profit before employee profit share and taxation7,0925,811 4,780 3,838 2,231 2,537 2,311 2,309 1,066 641 Employee profit share335- = - ~ - - - Group profit before taxation6,7575,811 4,780 3,838 2,231 2,537 2,311 2,309 1,066 641 Taxation2,3071,695 1,780 936 (495) 966 206 218 199 (7) Extraordinary items - - - ~ 69 - - 33 Dividends1,178977 792 639 509 410 287 256 224 139 Retained profit3,2723,139 2,208 2,263 2,217 1,092 1,818 1,835 643 476 Increase in ordinary share capital and reserves 78 55 35 124 135 27 7 510 85 Increase in ordinary shareholders' funds3,3503,194 2,243 2,387 2,352 1,119 1,825 1,835 1,153 561 Tangible fixed assets41,14134,411 25616 22,302 17,799 11,396 7,435 5,035 4,179 3,009 Unlisted investment = 45 45 = = = = = _ Net current assets/(liabilities) (14,600) (13,095) (7,465) (6,044) (3,114) 1,032 1,865 2,062 968 (20) Creditors due after one year(4,904)(3,029) (3,103) (3,453) (4,222) (4,317) (2,308) (1,930) (1,815) (810) Shareholders' funds21,63718,287 15,093 12,850 10,463 8,111 6,992 5,167 3,332 2,179 Preference shares7777777777 Ordinary shareholders' funds21,63018,280 15,086 12,843 10,456 8,104 6,985 5,160 3,325 2,172 Earnings per share 18-20p 12-06p 11-46p 6-72p 9-05p 9-O0lp 4-10p 3-21p Dividends per share 4-80p 4-00p 3-25p 2-63p 2:13p 1-75p 1-23p 1-10p 0-99p 0-68p Net assets per 10p ordinary share 88p 75p 62p 53p 44p 35p 30p 22p 16p llp Profit before taxation as % of group turnover (including VAT) 2:60% 2:36% 1:87% 2:79% 3:25% 1:94% 1-80% Return of profit before taxation on ordinary shareholders' funds29:9%21:°3% 31:3% 33:1% 44:8% 32:1% 29-5% Sales area at year end 000 sq. ft.) 634 593 533 $11 495 432 432 394 396 370 Sales area weighted average through year000 sq. ft.) 605 546 522 515 445 474 420 395 390 300 Average sales per sq. ft. per week£7-42£7-19 £6-77 £5-97 £5-16 £4-21 £3-80 £3-46 £2-66 £2-28 Number of stores at year end: Over20,000 sq. ft. 13 1 10 10 977665 - 20,000 sq. ft. 15 15 13 12 12 1 1 10 10 10 10,000 Other self-service stores 13 16 16 17 19 24 25 25 27 28 Number of employees: full-time (average through year)2,5732,516 2,458 2,211 1,890 1,963 1,896 1,782 1,663 1,308 part-time (average through year)2,7572,064 1,769 1,484 1,319 1,146 1,058 1,040 1,077 1981 and earlier years have been adjusted to reflect capitalisation issues. Printed by Watmoughs Limited, Idle, Bradford; and London 25