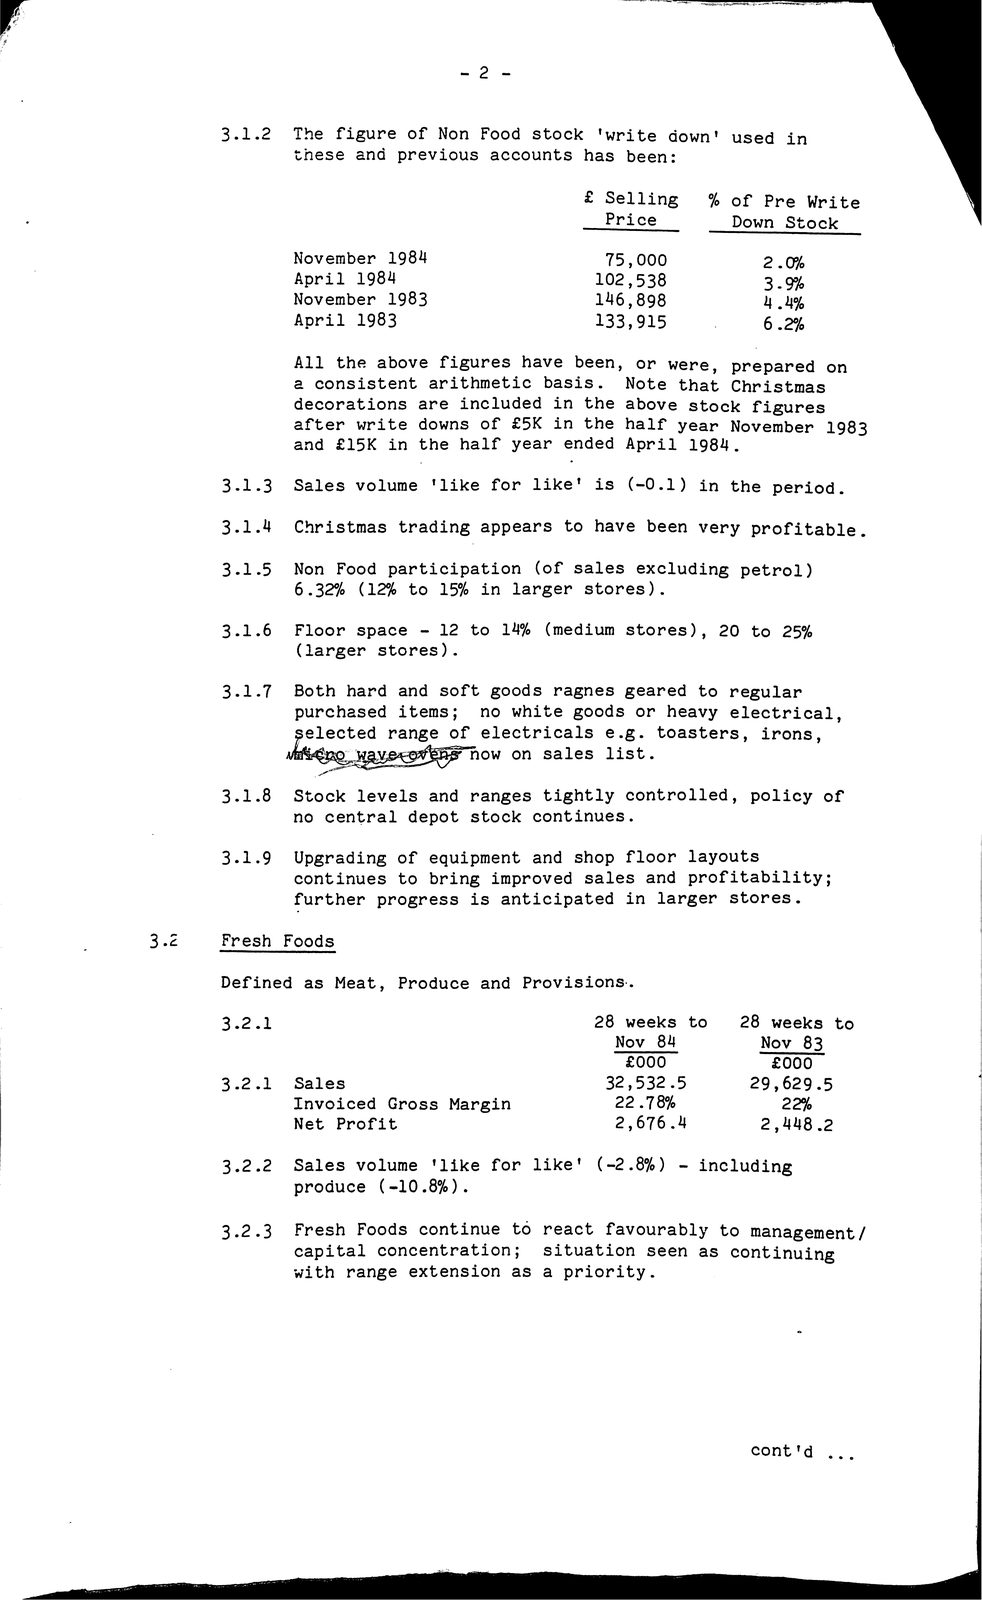
Below is what the machine read from this scan, three times over. They are kept separate rather than merged: where they disagree, the disagreement is itself worth seeing, and a single tidy transcription would hide it.
The left column is raw output. The right is the same text after the repairs that make it searchable — joining letter-spaced words, mending split ones.
Text already in the scan
                                                  - 2 -

           3.1.2     The  figure       of Non Food          stock   'write             down'  used   in
                     these    and     previous          accounts   has  been:

                                                                         Sellingf           % of  Pre  Write
                                                                     Price                    Down Stock
                     November         198^                           75,000                       2 .0%
                     April    1984                                  102,538                       3.9%
                     November         1983                          146,898                       4 .4%
                     April    1983                                  133,915                       6 .2%
                     All  the        above    figures have       been,    or           were,  prepared  on
                     a       consistent       arithmetic     basis.     Note            that  Christmas
                     decorations         are      included    in   the  above           stock    figures
                     after    write      downs      of    £5K in   the  half year             November  1983
                     and  £15K      in   the half year           ended  April           1984.

           3.1.3     Sales    volume          'like   for   like'   is  (-0.1)            in  the period.
           3.1.4     Christmas        trading       appears     to  have        been    very   profitable.

           3.1.5     Non  Food              participation   (of  sales    excluding            petrol)
                     6.32%    (12%      to    15%   in    larger   stores) .

           3.1.6     Floor    space      -      12      14%    (medium  stores), to         20 to  25%
                     (larger              stores).

           3.1.7     Both     hard    and     soft    goods     ragnes  geared            to  regular
                     purchased        items;        no  white    goods    or           heavy  electrical,
selected                          range of electricals               e .g .  toasters,            irons,
                              Ij^gie^y^^^ow              on  sales   list .

           3.1.8     Stock    levels          and    ranges    tightly  controlled,            policy   of
                     no   central            depot  stock   continues.

           3.1.9     Upgrading        of      equipment     and   shop  floor           layouts
                     continues        to      bring   improved               and        profitability; sales
                     further              progress         anticipated  in            larger  stores. is

    3 .2   Fresh    Foods

           Defined     as Meat,       Produce       and    Provisions.

           3.2.1                                                    28  weeks           to     28 weeks     to
                                                                       Nov    84                  Nov 83
                                                                        £000                      £000
           3.2.1     Sales                                           32,532       .5             29,629.5
                     Invoiced     Gross       Margin                   22   .78%    22%
                     Net  Profit                                       2,676      .4              2,448.2
           3.2.2     Sales    volume          'like   for   like'   (-2.8%)        -    including
                     produce   (-10 .8%).

           3.2.3     Fresh    Foods      continue        to  react   favourably             to management/
                     capital               concentration;    situation          seen    as    continuing
                     with     range    extension         as  a  priority.


                                                                                              cont 'd
- 2 - 3.1.2 The figure of Non Food stock 'write down' used in these and previous accounts has been: Sellingf % of Pre Write Price Down Stock November198^75,000 2 .0% April1984102,538 3.9% November1983146,898 4 .4% April1983133,915 6 .2% All the above figures have been, or were, prepared on a consistent arithmetic basis. Note that Christmas decorations are included in the above stock figures after write downs of £5K in the half year November1983 and £15K in the half year ended April1984. 3.1.3Sales volume 'like for like' is (-0.1) in the period. 3.1.4Christmas trading appears to have been very profitable. 3.1.5 Non Food participation (of sales excluding petrol) 6.32% (12% to 15% in larger stores) . 3.1.6Floor space - 1214%(medium stores), to 20 to 25% (larger stores). 3.1.7Both hard and soft goods ragnes geared to regular purchased items; no white goods or heavy electrical, selected range of electricals e .g . toasters, irons, Ij^gie^y^^^ow on sales list . 3.1.8Stock levels and ranges tightly controlled, policy of no central depot stock continues. 3.1.9Upgrading of equipment and shop floor layouts continues to bring improved and profitability; sales further progress anticipated in larger stores. is 3 .2 Fresh Foods Defined as Meat, Produce and Provisions. 3.2.128weeks to 28 weeks to Nov 84 Nov 83 £000 £000 3.2.1Sales32,532 .5 29,629.5 Invoiced Gross Margin22.78% 22% Net Profit2,676.4 2,448.2 3.2.2Sales volume 'like for like'(-2.8%)- including produce(-10.8%). 3.2.3Fresh Foods continue to react favourably to management/ capital concentration; situation seen as continuing with range extension as a priority. cont 'd
Read by machine highest quality of the three
-2-


    3.1.2     The  figure           of    Non   Food  stock   'write              down'  used  in
              these    and     previous            accounts  has  been:

                                                               Selling                   of  Pre£ % Write
                                                               Price                     Down  Stock

              November            1984                         75,000                        2.0%
              April    1984                                   102    ,538                    3.9%
              November            1983                        146,898                        4 4%
              April    1983                                   133,915                        6 .2%

              All  the           above    figures    have   been, or              were,  prepared   on
              a         consistent        arithmetic   basis.     Note             that  Christmas
              decorations             are     included   in  the  above            stock    figures
              after       write       downs     of  £5K  in  the  half             year  November   1983
              and  £15K      in       the     half  year   ended  April            1984.

    3.1.3     Sales         volume                for like'   is           (-0.1)    in  the   period.

    3.1.4     Christmas        trading          appears   to  have           been   very    profitable.

  3.1.5 Non Food participation (of sales excluding petrol)
              6.32%    12%          to    15%   in   larger  stores).

    3.1.6     Floor       space       -   12   to  14%   (medium  stores),            20    to 25%
              (larger                stores).

    3.1.7     Both     hard    and        soft    goods   ragnes  geared             to  regular
              purchased        items;           no  white   goods   or            heavy  electrical,
                  range                   of    electricals    e.g.    toasters,             irons,
                                               how  on  sales  list.

    3.1.8     Stock         levels        and  ranges    tightly  controlled,               policy  of
              no   central      depot          stock   continues.

    3.1.9     Upgrading        of         equipment    and  shop  floor            layouts
              continues        to         bring   improved                and sales     profitability;
              further                progress  is    anticipated  in             larger  stores.

.   Fresh    Foods

    Defined     as Meat,       Produce          and   Provisions..

    3.2.1                                                     28  weeks            to    28   weeks   to
                                                                 Nov       84               Nov  83
                                                                                            ~
                                                                  £000                      £000
    3.2.1     Sales                                                                         29,629.5
              Invoiced     Gross          Margin                 22      .78%                  22%
              Net  Profit                                        2,676.4                     2,448.2

    3.2.2     Sales    volume                     for  like'  (-2.8%)            - including
              produce   (-10.8%).

  3.2.3 Fresh Foods continue to react favourably to
    capital concentration; situation seen as continuing
    with range extension as a priority.
-2- 3.1.2 The figure of Non Food stock 'write down' used in these and previous accounts has been: Selling of Pre£ % Write Price Down Stock November198475,000 2.0% April1984102 ,538 3.9% November1983146,898 4 4% April1983133,915 6 .2% All the above figures have been, or were, prepared on a consistent arithmetic basis. Note that Christmas decorations are included in the above stock figures after write downs of £5K in the half year November1983 and £15K in the half year ended April1984. 3.1.3Sales volume for like' is (-0.1) in the period. 3.1.4Christmas trading appears to have been very profitable. 3.1.5 Non Food participation (of sales excluding petrol) 6.32% 12% to 15% in larger stores). 3.1.6Floor space - 12 to 14%(medium stores), 20 to 25% (larger stores). 3.1.7Both hard and soft goods ragnes geared to regular purchased items; no white goods or heavy electrical, range of electricals e.g. toasters, irons, how on sales list. 3.1.8Stock levels and ranges tightly controlled, policy of no central depot stock continues. 3.1.9Upgrading of equipment and shop floor layouts continues to bring improved and sales profitability; further progress is anticipated in larger stores. . Fresh Foods Defined as Meat, Produce and Provisions.. 3.2.128weeks to 28 weeks to Nov 84 Nov 83 ~ £000 £000 3.2.1Sales29,629.5 Invoiced Gross Margin22.78% 22% Net Profit2,676.42,448.2 3.2.2Sales volume for like'(-2.8%)- including produce(-10.8%). 3.2.3Fresh Foods continue to react favourably to capital concentration; situation seen as continuing with range extension as a priority.
Read by machine, contrast corrected
-2-


    3.1.2     The  figure           of    Non   Food  stock   'write              down'  used  in
              these    and     previous            accounts  has  been:

                                                               Selling                   of  Pre£ % Write
                                                               Price                     Down  Stock

              November            1984                         75,000                        2.0%
              April    1984                                   102    ,538                    3.9%
              November            1983                        146,898                        4 4%
              April    1983                                   133,915                        6 .2%

              All  the           above    figures    have   been, or              were,  prepared   on
              a         consistent        arithmetic   basis.     Note             that  Christmas
              decorations             are     included   in  the  above            stock    figures
              after       write       downs     of  £5K  in  the  half             year  November   1983
              and  £15K      in       the     half  year   ended  April            1984.

    3.1.3     Sales         volume                for like'   is           (-0.1)    in  the   period.

    3.1.4     Christmas        trading          appears   to  have           been   very    profitable.

  3.1.5 Non Food participation (of sales excluding petrol)
              6.32%    12%          to    15%   in   larger  stores).

    3.1.6     Floor       space       -   12   to  14%   (medium  stores),            20    to 25%
              (larger                stores).

    3.1.7     Both     hard    and        soft    goods   ragnes  geared             to  regular
              purchased        items;           no  white   goods   or            heavy  electrical,
                  range                   of    electricals    e.g.    toasters,             irons,
                                               how  on  sales  list.

    3.1.8     Stock         levels        and  ranges    tightly  controlled,               policy  of
              no   central      depot          stock   continues.

    3.1.9     Upgrading        of         equipment    and  shop  floor            layouts
              continues        to         bring   improved                and sales     profitability;
              further                progress  is    anticipated  in             larger  stores.

.   Fresh    Foods

    Defined     as Meat,       Produce          and   Provisions..

    3.2.1                                                     28  weeks            to    28   weeks   to
                                                                 Nov       84               Nov  83
                                                                                            ~
                                                                  £000                      £000
    3.2.1     Sales                                                                         29,629.5
              Invoiced     Gross          Margin                 22      .78%                  22%
              Net  Profit                                        2,676.4                     2,448.2

    3.2.2     Sales    volume                     for  like'  (-2.8%)            - including
              produce   (-10.8%).

  3.2.3 Fresh Foods continue to react favourably to
    capital concentration; situation seen as continuing
    with range extension as a priority.
-2- 3.1.2 The figure of Non Food stock 'write down' used in these and previous accounts has been: Selling of Pre£ % Write Price Down Stock November198475,000 2.0% April1984102 ,538 3.9% November1983146,898 4 4% April1983133,915 6 .2% All the above figures have been, or were, prepared on a consistent arithmetic basis. Note that Christmas decorations are included in the above stock figures after write downs of £5K in the half year November1983 and £15K in the half year ended April1984. 3.1.3Sales volume for like' is (-0.1) in the period. 3.1.4Christmas trading appears to have been very profitable. 3.1.5 Non Food participation (of sales excluding petrol) 6.32% 12% to 15% in larger stores). 3.1.6Floor space - 12 to 14%(medium stores), 20 to 25% (larger stores). 3.1.7Both hard and soft goods ragnes geared to regular purchased items; no white goods or heavy electrical, range of electricals e.g. toasters, irons, how on sales list. 3.1.8Stock levels and ranges tightly controlled, policy of no central depot stock continues. 3.1.9Upgrading of equipment and shop floor layouts continues to bring improved and sales profitability; further progress is anticipated in larger stores. . Fresh Foods Defined as Meat, Produce and Provisions.. 3.2.128weeks to 28 weeks to Nov 84 Nov 83 ~ £000 £000 3.2.1Sales29,629.5 Invoiced Gross Margin22.78% 22% Net Profit2,676.42,448.2 3.2.2Sales volume for like'(-2.8%)- including produce(-10.8%). 3.2.3Fresh Foods continue to react favourably to capital concentration; situation seen as continuing with range extension as a priority.