Auditors Discussion Points 1984 page 6 of 10 previous next
Below is what the machine read from this scan, three times over. They are kept separate rather than merged: where they disagree, the disagreement is itself worth seeing, and a single tidy transcription would hide it.
The left column is raw output. The right is the same text after the repairs that make it searchable — joining letter-spaced words, mending split ones.
Text already in the scan
   Appendix C


                              MATTERS    requiring     CONSIDERATION

            An  analysis  of the     annual results     show    the following  figures
            for the  past   two    years:
                                   28 Wks       To      2M  Wks   To  20 Wks   To   2M     Wks To
                                   Nov.             82   May     83    Nov.   83    Apr.          6H
                                     £1000    £'000    £'000                              £'000
            Turnover    (inc . vhi/           100,29i»      103,965      117,645             115,759
                                               /•
            Profit   On  Trading                 2,740      3,186        3,604          3,861
1           Interest    Paid   (Net)               129         (14)          193                 180
!           Profit   Pre Profit                      1        3,200      3,411          3,681
            Share  & Pre-Taxaticn           2,61
1!1         % Of Turnover                        2,60%        3.08%      2.90%          3.18%
i
!•
      j     Profit   Pre-Taxation                                        3,263          3,494
                                                                         2.77%          3.02%

       Included in the above net profits are the following figures

            Non  Foods  -
            Met  Profit   (Loss)               (124)          (138)         14                 114

             New Stores   Contrib-
             u'oions (see   6  below'          (183)          (303)        (39)                  >30

             Note  the  Ncn    Food   net profit/loss   figures   and New Stores    contrib
             ution   totals    are   exoraooed from     monthly accounts:  note    also  tnat
       the Non Food figures include part of the New Stores totals .
       2 .   Sales   volumes/inflation    figures     are   as follows:-
                                                        52    Wks To  24   Wks To    28  Wks     To
                                Apr.                               84   Apr.   84     Nov.        83

                                                            +14.3%       +11.3%         _i_1 "
            Actual    Sales    Revenue    Increase                                          <    0/0
            Average     Inflation                           +  5.7%      +  6.3%               ^  /c
            Real   Sales  (Vol.)                            +  8.1%      +  4.8%             1 ^ .5%

       The Real Sales (volume' increase can be divided as to:-
            New   Stores*     (below.                       +  9.3%      + 9.5%         +      r  . 2%
            Closed   Stores**    (-                            0.1%)    (- 0.1%)
            Other    Stores                                (-  1.1%)    (- 4.2%)

                                                               8.1%      +  ii.8%       + 1 •     .6%
Appendix C MATTERS requiring CONSIDERATION An analysis of the annual results show the following figures for the past two years: 28 Wks To 2M Wks To 20 Wks To 2M Wks To Nov. 82 May 83 Nov. 83 Apr. 6H £1000 £'000 £'000 £'000 Turnover (inc . vhi/ 100,29i» 103,965 117,645 115,759 /• Profit On Trading2,7403,186 3,604 3,861 1 Interest Paid (Net) 129 (14) 193 180 ! Profit Pre Profit13,200 3,411 3,681 Share & Pre-Taxaticn 2,61 1!1 % Of Turnover2,60%3.08% 2.90% 3.18% i !• j Profit Pre-Taxation 3,263 3,494 2.77% 3.02% Included in the above net profits are the following figures Non Foods - Met Profit (Loss)(124)(138) 14 114 New Stores Contrib- u'oions (see 6below'(183) (303) (39) >30 Note the Ncn Food net profit/loss figures and New Stores contrib ution totals are exoraooed from monthly accounts: note also tnat the Non Food figures include part of the New Stores totals . 2 . Sales volumes/inflation figures are as follows:- 52 Wks To 24 Wks To 28 Wks To Apr. 84 Apr. 84 Nov. 83 +14.3% +11.3% _i_1 " Actual Sales Revenue Increase<0/0 Average Inflation+5.7% + 6.3% ^ /c Real Sales (Vol.) + 8.1% + 4.8% 1 ^ .5% The Real Sales (volume' increase can be divided as to:- New Stores* (below.+9.3% + 9.5% + r . 2% Closed Stores**(-0.1%) (- 0.1%) Other Stores(-1.1%) (- 4.2%) 8.1% + ii.8% + 1 • .6%
Read by machine highest quality of the three
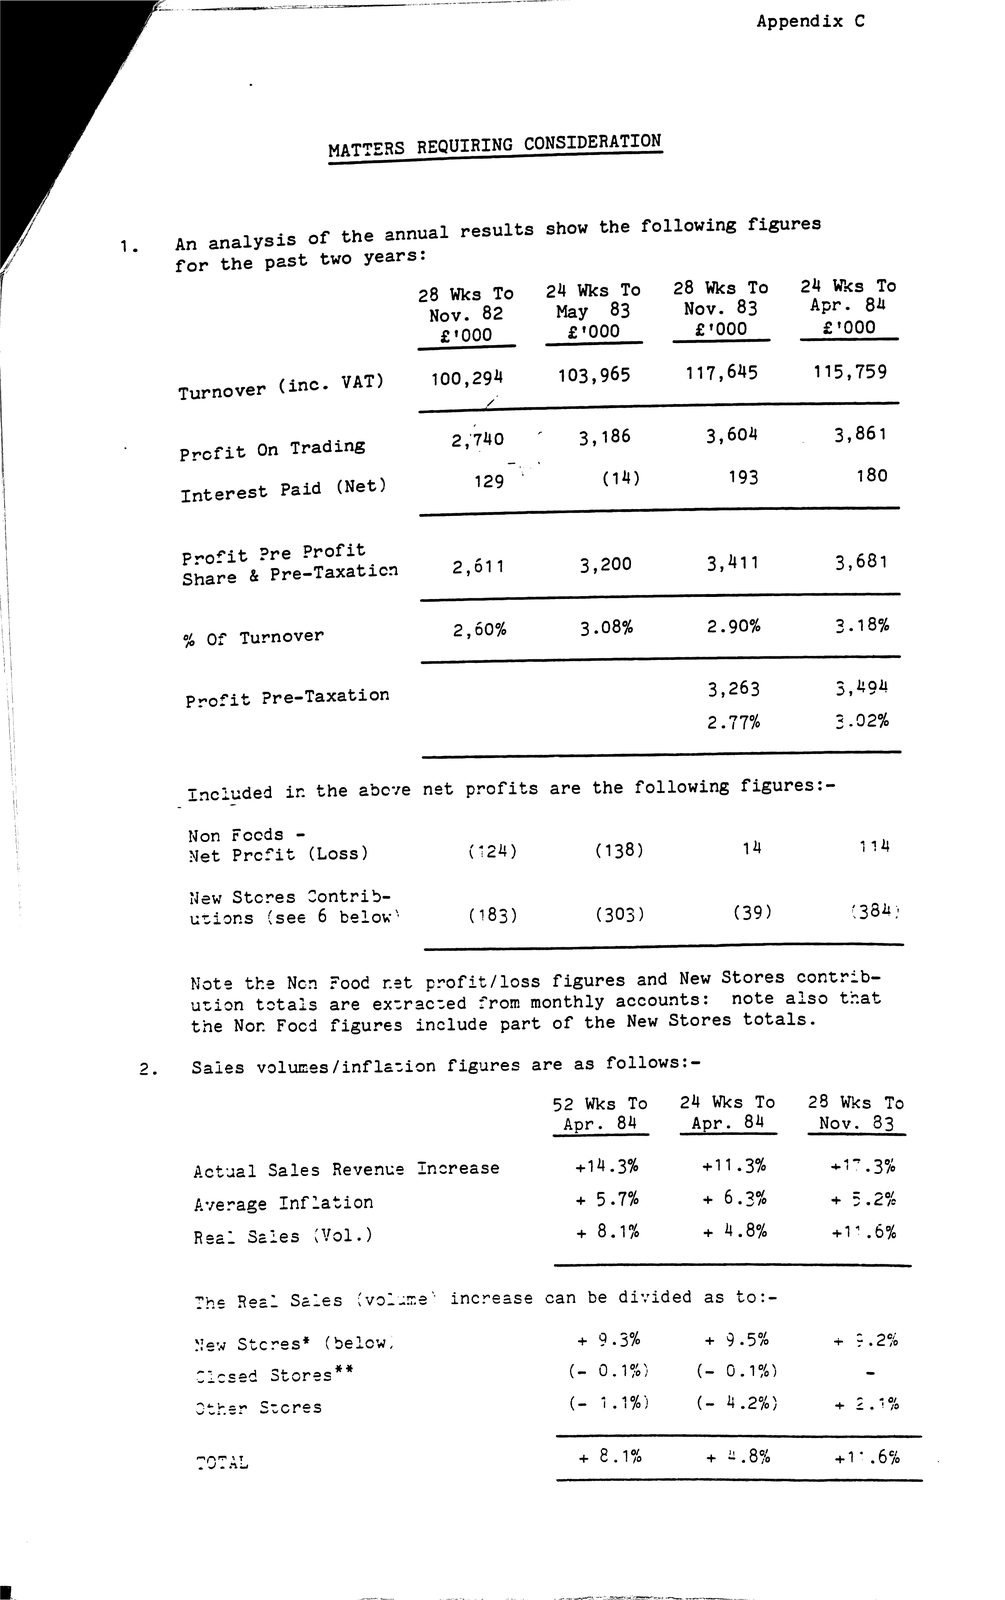
   Appendix C


   MATTERS REQUIRING CONSIDERATION


   An  analysis  of  the   annual results  show        the    following  figures
   for the  past  two    years:
                         28     Wks    To  24      Wks To     28  Wks    To    24  Wks   To
                         Nov.         82   May          83     Nov.      83      Apr.  84
                         £1000                                               £1000
   Turnover   (ine.  VAT)     100,294              103,965          117,645       115,759
   Profit  On  Trading            2,740              3,186        3,    604        3,861
   Interest   Paid   (Net)            129             (14)              193           180

   Profit  Pre  Profit
   Share  & Pre-Taxaticen         2,611              3,200        3,411            3,681

  Of     Turnover                                  3.08%          2.90%            2.18%

Profit      Pre-Taxation                                          3,263            3,404
                                                                  2.77%            2.02%

                         ES

   Inciuded   in the     net          profits are     the     following figures:-

   Non  Foeds  -
   Net  Prefit   (Loss)                               (138)                14

   New  Stores   Contribd-
   utions   (see  6  below’                           (303)           (39)            (364;

   Note  the  Nen    Food  rat profit/loss    figures     and  New  Stores     contrib-
   ution   totals    are   exztraczed from monthly     accounts:      note    also   tnat
   the  Nor  Focd    figures   include     part of the    New  Stores   totals.

 Saies volumes/inflezion figures are as follows:-

                                      52           Wks    To   24  Wks   To     28   Wks To
                                                               _Apr.    84        Nov.   83

   Actual   Sales    Revenue   Inorease            +14 .3%        +11.3%           +17   3%
   Average    Inflation                            +  5.7%        +      6.2%      +   5.2%
   Real   Seles  (Vol.)                             + 8.1%        +      4.8%      +17  .6%


                     increase     can              be   divided  as  to:-

                                                   +    9.3%      +  9.5%   +      2.2%

                                   - 0.1%                        (=  6.1%          -

                                   - 1.1%                        (=  4.2%   +      2.7%

                                  —
                                                   +              +  4.8%
Appendix C MATTERS REQUIRING CONSIDERATION An analysis of the annual results show the following figures for the past two years: 28 Wks To 24 Wks To 28 Wks To 24 Wks To Nov. 82 May 83 Nov. 83 Apr. 84 £1000 £1000 Turnover (ine. VAT) 100,294 103,965 117,645 115,759 Profit On Trading2,7403,186 3, 604 3,861 Interest Paid (Net) 129 (14) 193 180 Profit Pre Profit Share & Pre-Taxaticen 2,611 3,200 3,411 3,681 Of Turnover3.08%2.90% 2.18% Profit Pre-Taxation 3,263 3,404 2.77% 2.02% ES Inciuded in the net profits are the following figures:- Non Foeds - Net Prefit (Loss)(138)14 New Stores Contribd- utions (see 6below'(303) (39) (364; Note the Nen Food rat profit/loss figures and New Stores contrib- ution totals are exztraczed from monthly accounts: note also tnat the Nor Focd figures include part of the New Stores totals. Saies volumes/inflezion figures are as follows:- 52 Wks To 24 Wks To 28 Wks To _Apr. 84 Nov. 83 Actual Sales Revenue Inorease +14 .3% +11.3% +17 3% Average Inflation+5.7% + 6.2% + 5.2% Real Seles (Vol.) + 8.1% + 4.8% +17 .6% increase can be divided as to:- + 9.3% + 9.5% + 2.2% - 0.1% (= 6.1% - - 1.1% (= 4.2% + 2.7% - + + 4.8%
Read by machine, contrast corrected
   Appendix C


   MATTERS REQUIRING CONSIDERATION


   An  analysis  of  the   annual results  show        the    following  figures
   for the  past  two    years:
                         28     Wks    To  24      Wks To     28  Wks    To    24  Wks   To
                         Nov.         82   May          83     Nov.      83      Apr.  84
                         £1000                                               £1000
   Turnover   (ine.  VAT)     100,294              103,965          117,645       115,759
   Profit  On  Trading            2,740              3,186        3,    604        3,861
   Interest   Paid   (Net)            129             (14)              193           180

   Profit  Pre  Profit
   Share  & Pre-Taxaticen         2,611              3,200        3,411            3,681

  Of     Turnover                                  3.08%          2.90%            2.18%

Profit      Pre-Taxation                                          3,263            3,404
                                                                  2.77%            2.02%

                         ES

   Inciuded   in the     net          profits are     the     following figures:-

   Non  Foeds  -
   Net  Prefit   (Loss)                               (138)                14

   New  Stores   Contribd-
   utions   (see  6  below’                           (303)           (39)            (364;

   Note  the  Nen    Food  rat profit/loss    figures     and  New  Stores     contrib-
   ution   totals    are   exztraczed from monthly     accounts:      note    also   tnat
   the  Nor  Focd    figures   include     part of the    New  Stores   totals.

 Saies volumes/inflezion figures are as follows:-

                                      52           Wks    To   24  Wks   To     28   Wks To
                                                               _Apr.    84        Nov.   83

   Actual   Sales    Revenue   Inorease            +14 .3%        +11.3%           +17   3%
   Average    Inflation                            +  5.7%        +      6.2%      +   5.2%
   Real   Seles  (Vol.)                             + 8.1%        +      4.8%      +17  .6%


                     increase     can              be   divided  as  to:-

                                                   +    9.3%      +  9.5%   +      2.2%

                                   - 0.1%                        (=  6.1%          -

                                   - 1.1%                        (=  4.2%   +      2.7%

                                  —
                                                   +              +  4.8%
Appendix C MATTERS REQUIRING CONSIDERATION An analysis of the annual results show the following figures for the past two years: 28 Wks To 24 Wks To 28 Wks To 24 Wks To Nov. 82 May 83 Nov. 83 Apr. 84 £1000 £1000 Turnover (ine. VAT) 100,294 103,965 117,645 115,759 Profit On Trading2,7403,186 3, 604 3,861 Interest Paid (Net) 129 (14) 193 180 Profit Pre Profit Share & Pre-Taxaticen 2,611 3,200 3,411 3,681 Of Turnover3.08%2.90% 2.18% Profit Pre-Taxation 3,263 3,404 2.77% 2.02% ES Inciuded in the net profits are the following figures:- Non Foeds - Net Prefit (Loss)(138)14 New Stores Contribd- utions (see 6below'(303) (39) (364; Note the Nen Food rat profit/loss figures and New Stores contrib- ution totals are exztraczed from monthly accounts: note also tnat the Nor Focd figures include part of the New Stores totals. Saies volumes/inflezion figures are as follows:- 52 Wks To 24 Wks To 28 Wks To _Apr. 84 Nov. 83 Actual Sales Revenue Inorease +14 .3% +11.3% +17 3% Average Inflation+5.7% + 6.2% + 5.2% Real Seles (Vol.) + 8.1% + 4.8% +17 .6% increase can be divided as to:- + 9.3% + 9.5% + 2.2% - 0.1% (= 6.1% - - 1.1% (= 4.2% + 2.7% - + + 4.8%