Draft board Memorandum on Profit Forecast 1987-1988 page 10 of 15 previous next
Below is what the machine read from this scan, three times over. They are kept separate rather than merged: where they disagree, the disagreement is itself worth seeing, and a single tidy transcription would hide it.
The left column is raw output. The right is the same text after the repairs that make it searchable — joining letter-spaced words, mending split ones.
Text already in the scan
h*'       CD          OQ
Q)        p           r r     _Fixed Assets                                                                                                             8B539^06^^^^^92.
          o           c t     IN.D.V. at start of period
          CD          CO
<<        3                   INet  Asset     ReolacBBent
CD        CD                  ISale of Property                  at M.D.V.
0)        D           CO      {New  Stores    Under              Const"n
          c t         CO
                      c       {C a p i t a l i s a t i o n   o f I  n t e r e s t
CD        03          CD      {Deo rec i at io r
P         D                                                                                                                                             90649.0 92492.0 94024^
C L,      C u         o'      H.D.V.     Carried             Forward
OQ                    CD
H-C                          TOTAL ASSETS
<         3           O                                                                                                                                 56S5 1.4      58032.5     5''4: .0.0
     •                03                                                                                                                                =====r c=======r============
D                     CO     SHARE CAPITAL & RESERVES                                                                                                   20326.9       20326.9     20326.9
O Q            P
          OQ
H    -         O              .Profit & Loss Account                             29598.7    30525.3     31501.5      32262.6     33049.2     34170.2    35239.9       36524.5 V705J^                                Wm.i 39004.\ 4«13.7
C O       *-*)                {Balance at     Start              of Period
CD             r t            'Profit on Trading                                    993.4   1049.3      1197.2       1208.4      12 12.6     1153.2     1395.4        1264.0                                       1138.0 1419.6Vt?02.6
c    t-        = r            {Profit on Sale of Property                                                  175.0
O         C D                 {Takeover   Defence Costs                                                 -500.0
                              {Eaplovee       Profit         Share               - 6 6 . 8  - 7 3 . 1   - 1 1 1 . 1  - 9 0 . 8   - 9 1 . 6   - 8 3 . 5  - 1 1 0 . 8   - 8 2 . 9   - 1 1 1 . 9   - 7 7 .     0 - 1 0 9 . 7    - 11 8 . 3
                              {Dividends      Paid                                                                                                                                              -698.4
                              {Dividends      Payable
                              {P refe re nce  D iv ide nd
                              {Taxat io n

                              Closing Balance                                    30525.3    31501.5     32262.6      33049.2     34170.2     35239.9        36524.5   37705.6     39103.1      3 9 0 0 4. 8   4 0 313. 7     416 9 8. 0

                             TOTAL SHAREHOLDERS FUNDS                            50852.2    51828.4     52589.5      53376.1     54497.1     55566.8    5t951.4       58032.5     59430.0      5 9 3 3 1. 7  6 0 6 4 0. 6  6 2 0 2 4. 9
h*' CD OQ
Q) prr _Fixed Assets 8B539^06^^^^^92.
oct IN.D.V. at start of period
CD CO
<< 3 INet Asset ReolacBBent
CD CD ISale of Property at M.D.V.
0) D CO {New Stores Under Const"n
c t CO
c {C apitalisationofInterest
CD 03 CD {Deo rec i at io r
P D 90649.0 92492.0 94024^
C L, C u o' H.D.V. Carried Forward
OQ CD
H-C TOTAL ASSETS
< 3 O 56S5 1.4 58032.5 5''4: .0.0
• 03 =====r c=======r============
D CO SHARE CAPITAL &RESERVES20326.9 20326.9 20326.9
OQP
OQ
H - O .Profit & Loss Account29598.730525.3 31501.5 32262.6 33049.2 34170.2 35239.9 36524.5 V705J^ Wm.i 39004.\ 4«13.7
C O *-*){Balance at Start of Period
CD r t 'Profit on Trading993.41049.3 1197.2 1208.4 12 12.6 1153.2 1395.4 1264.0 1138.0 1419.6Vt?02.6
c t- = r {Profit on Sale of Property175.0
OCD {Takeover Defence Costs-500.0
{Eaplovee Profit Share - 6 6 . 8 - 7 3 . 1 - 111 . 1 - 9 0 . 8 - 9 1 . 6 - 8 3 . 5 - 110 . 8 - 8 2 . 9 - 111 . 9 - 7 7 . 0 - 109 . 7 - 11 8 . 3
{Dividends Paid-698.4
{Dividends Payable
{P reference D iv ide nd
{Taxation
Closing Balance30525.331501.5 32262.6 33049.2 34170.2 35239.9 36524.5 37705.6 39103.1 3900 4. 840 313. 7 416 9 8. 0
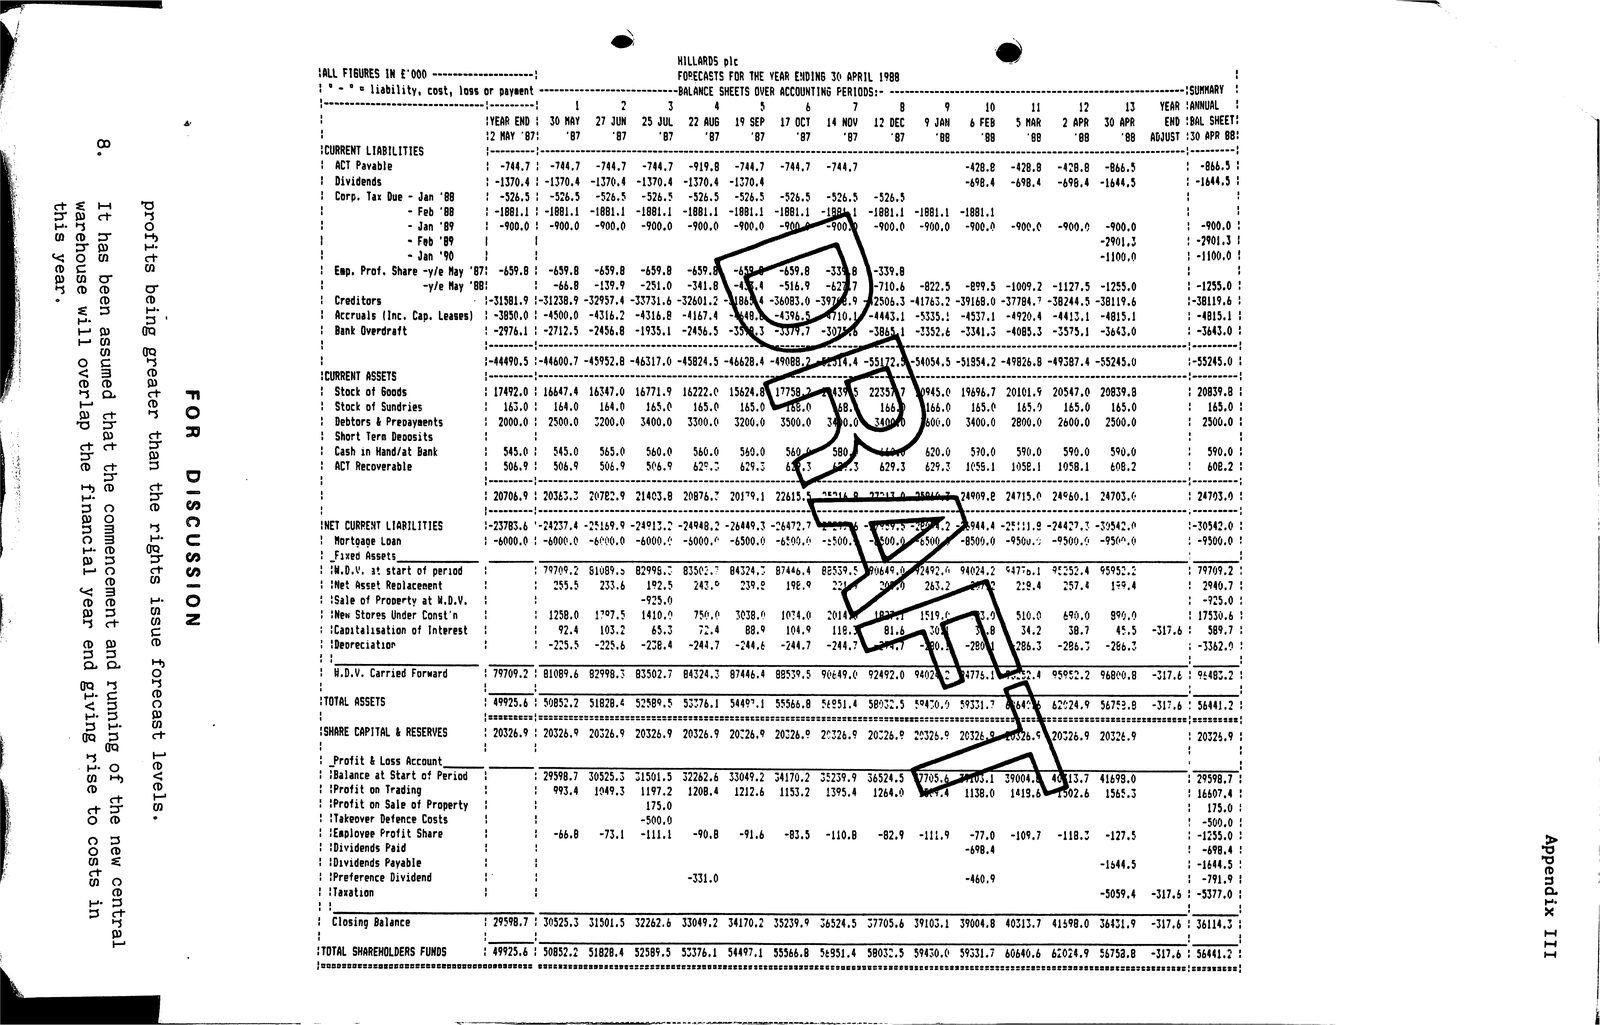
TOTAL SHAREHOLDERS FUNDS50852.251828.4 52589.5 53376.1 54497.1 55566.8 5t951.4 58032.5 59430.0 5933 1. 76064 0. 66202 4. 9Read by machine highest quality of the three
 \
 °  HILLARDS  ple  @
 TALL  FIGURES   IN  £'000  H  THE  30  ' FORECASTS FOR YEAR ENDING APRIL 1988
 1"  =   °  ©  liability,  cost,  loss   or  payaent BALANCE SHEETS OVER ACCOUNTING PERIQDS:-
 \  2  3  4  5  6  7  8  9  10  12  13  YEAR
 '  END  +  30  MAY  JUN)  AUG  SEP  OCT  DEC  JAN  FEB  SHAR  APR  APR  END  ‘BAL  SHEET: «25 JUL) «22 «19 17 12 9 6 2 30
 12  HAY  ‘87  87  ‘87  ‘87  "87  87  ‘87  “BB  "88  88  “88  BB  ADJUST  $30  APR   8B:
 @  LIABILITIES  :
 |  ACT Pavable  “428.8  -428.8  -428.8  -866.5  +
 |  Dividends  1  ¢  -1370.4  -1370.4  -1370.4  +
 ¢  3  H  Corp.  Tax   Due  - Jan  ‘88  1  -526.5  -526.5  :
 - Feb  ‘8B  ¢  -1881.1  -1881.1  BB  -1881.1  ‘
 fe)  H  - Jan  =900.0  -900.0  -900.0  -900.0  -900.0  -900.0  -900.0  -900.0  -900.0  -900.0
 no  !  ~ Fob  ‘89  |  |  2904.5  1
 aes?  &  =1100,0  1  1100.0 !
 os  n  |  Eap.   Prof.   Share  -y/e  Hay  ‘87!  -659.8  -659.8  -659.8  -659.8  -339.8  :  ;
 4  o  H  May  ‘BB!  1  966.8  -B899.5  -1009.2  -1127.5  -1255.0  1
 °  =.  5  @  Creditors  1-31238.9  -32957.4  -33731.6  -32601.2  -36083.0  2506.3  -41763,2  -39168.0  -37784.7   -38244.5  -38119.6  |
 5  +  Accruals  (Inc.  Cap.  Leases)  |  -3850.0  |  -4500.0  -4316.2  -4167.4  .  4815.1  +
 te  ga  +  Bank  Overdraft  1  1  -2456.8  -1935.1  -2456.5  3352.6  -3341.3  -4085.3  -3575.1  -3643.0  1  |
 !  tag  Inn  H
 °  8  :  -45952.8  -45824.5  -49826.8   -49387.4  -55245.0  |
 3  4  ASSETS  nn  Lae  '
 ae’  ct  Stock  of   Goods  1  17492.0  16647.4  19696.7  20101.9  20547.0  20839.8  +  20839.8  |
 o  Stock  of   Sundries  +  163.0:  164.0  168.0  165.0  165.0  165.0  165.9  165.6  165.0  +  165.01
 3  |  Debtors  &   Prepayaents  +  2000.0  |  2300.0  3200.0  3400.0  3300.0  3200.0  3400.0  2800.0  2600.0  2500.0  +  2506.0  ¢
 re)  ac  |  Short  Deoosits  '  H  :
 :  >  Cash   in  Hand/at  Bank  +  $45.0)  545.0  565.0  =   60.0  60.0  =  540.0  570.0  590.0  590.0  590.0  +  $90.0!
 @  ¢  =}  o  ACT  Recoverable  t  506.9  +  506.9  = 506.9  =  806.9  =  628.3  629.5  1055.1  1058.1  608.2  +  608.2 =
 ©  ¢  =  :  +  20706.9  |  20363.2  20782.9  20179.  24715.0  +  24793.9
 30  o
 g  5  ©  INET  CURRENT  '-24237.4  -28169,9  -24013,2  -26472,7  :  A  |
 Cc  |  Mortoage  Loan  1  1  -6000.0  -6000.%  -5000.%  -6500.0  -6804.0  so  -956u.5  -9500.%  + q
 » 8  n  Faxed Assets
 ke  oO  ct  wo  +  at   start  of  period  =|  1  79709,2  G1089.5  83502.7?  87446,4  94024.2  9825204  95952.  +  79709.2 BES
7  tet  g  a  +  iNet  Asset  Hy  +  285.5  233.6  =  192.5  243.0  239.2  198.8  Pp  257.8  199.4  +  2940.7
 ve  of  Property  at  '  925.0  +  925.0  |
a  9  5  a  z2  +  iNew   Stores  Under  Const'n  H  +  1258.0  1797.5  750.0  «3038.0  «10740  10.4  699.0  99,0  1  ¢
a  sot  Cc  +  of  Interest  |  +  92.4  103.2  65.3  Pa  68.9  118,  34.2  38.7  -317.6 +  989.7  |
 g  @  tDeoreciationr  1  225,58  -244,7  86.3  -286.3  -266.2  +  |
 a  |  Carried  Forward  +  79709.2  +  82998.3  B3502.7  84324.3  87446.4  8B539,5   90649.0  95952.2  -317.6 |  94483.2  |
 ga  3  @  H  ASSETS  :  :  H
 1  49925.6  |  50B52,2  5182.4  54497.  S4951,4
 5  a  ‘SHARE  &  |  | |
 CAPITAL
 ga  H  RESERVES  +  20326.9  20326.9  20326.9  20326.9  20326.9  20726.9  20326.9  2052.9  20326.9  20326.9  +  20325.9  |
 H  H
i  36  +  Profit &  Loss  Account
 <  i  iBalance  at Start  of  Period  |  32262.6  33049.2  34170.2  38239.9  36524.5  4  1  29598.7
 oO  rh  {Profit  on   Trading  Hy  +  993.4  A  |
 +f  1  +  1197.2  1208.4  1212.6  1153.2  1395.4  1264.0  Yet  1138.0  02.6  1568.3  +  16607.4
 Oo  tProfit  on   Sale  of  Property  !  175.0  175.0!
 Oo  Oo  °  |  tTakeover  Defence  Costs  '  7300.0  | =
 o3  Profit  Share  :  +  7668  73.1  90.8  82,9  +  71255.0  :
 Paid  H  H  ! x}tpueddy
 n=  |  {Dividends  Payable  H  t  +  7644.5  ¢
 a  fo)  Dividend  '  1  -791.9
 @  1  |  -5377.0  5
 ed  !
 5  gq  |  Closing  Balance  +  29598.7  30525.3  32262.6  33049.2  34170,2  35239.9  36524.5  37705.6  39103.1  39004,8  41598.0  36431.9  -317.6  |  3114.3  3
 i  H  : III
 ‘TOTAL  SHAREHOLDERS  FUNDS  +  49925.6  50B52.2  51828.4  52589.5  53376.1  54497.1  $5566.8  5¢951.4  58032.5  59430.0  $9531.7  60640.6  62024.9  -317.6  56441.2
 H


                                                      _                                                          —                                                                                              a                                ae ee
\
° HILLARDS ple @
TALL FIGURES IN £'000 H THE 30 ' FORECASTS FOR YEAR ENDING APRIL1988
1" = ° © liability, cost, loss or payaent BALANCE SHEETS OVER ACCOUNTING PERIQDS:-
\ 23456789 10 12 13 YEAR
' END + 30 MAY JUN) AUG SEP OCT DEC JAN FEB SHAR APR APR END 'BAL SHEET:«25 JUL) «22 «19 17 12 962 30
12 HAY '87 87 '87 '87 "87 87 '87 "BB "88 88 "88 BB ADJUST$30 APR 8B:
@ LIABILITIES :
| ACT Pavable "428.8 -428.8 -428.8 -866.5 +
| Dividends 1 ¢ -1370.4 -1370.4 -1370.4 +
¢ 3 H Corp. Tax Due - Jan '88 1 -526.5 -526.5 :
- Feb '8B ¢ -1881.1 -1881.1 BB -1881.1 '
fe) H - Jan =900.0 -900.0 -900.0 -900.0 -900.0 -900.0 -900.0 -900.0 -900.0 -900.0
no ! ~ Fob '89 | | 2904.5 1
aes? & =1100,0 1 1100.0 !
os n | Eap. Prof. Share -y/e Hay '87! -659.8 -659.8 -659.8 -659.8 -339.8 : ;
4oH May 'BB! 1 966.8 -B899.5 -1009.2 -1127.5 -1255.0 1
° =. 5 @Creditors1-31238.9 -32957.4 -33731.6 -32601.2 -36083.0 2506.3 -41763,2 -39168.0 -37784.7 -38244.5 -38119.6 |
5 + Accruals (Inc. Cap. Leases)|-3850.0 | -4500.0 -4316.2 -4167.4 . 4815.1 +
te ga + Bank Overdraft 1 1 -2456.8 -1935.1 -2456.5 3352.6 -3341.3 -4085.3 -3575.1 -3643.0 1 |
! tag Inn H
° 8 : -45952.8 -45824.5 -49826.8 -49387.4 -55245.0 |
3 4 ASSETS nn Lae '
ae' ct Stock of Goods117492.0 16647.4 19696.7 20101.9 20547.0 20839.8 + 20839.8 |
o Stock of Sundries+163.0: 164.0 168.0 165.0 165.0 165.0 165.9 165.6 165.0 + 165.01
3 | Debtors & Prepayaents + 2000.0 | 2300.0 3200.0 3400.0 3300.0 3200.0 3400.0 2800.0 2600.0 2500.0 + 2506.0 ¢
re) ac | Short Deoosits ' H :
: > Cash in Hand/at Bank+$45.0) 545.0 565.0 = 60.0 60.0 = 540.0 570.0 590.0 590.0 590.0 + $90.0!
@ ¢ =} o ACT Recoverable t 506.9 + 506.9 = 506.9 = 806.9 = 628.3 629.5 1055.1 1058.1 608.2 + 608.2 =
© ¢ = : + 20706.9 | 20363.2 20782.9 20179. 24715.0 + 24793.9
30 o
g 5 © INET CURRENT'-24237.4-28169,9 -24013,2 -26472,7 : A |
Cc | Mortoage Loan 1 1 -6000.0 -6000.% -5000.% -6500.0 -6804.0 so -956u.5 -9500.% + q
» 8 n Faxed Assets
ke oO ct wo + at start of period =| 1 79709,2 G1089.5 83502.7? 87446,4 94024.2 9825204 95952. + 79709.2 BES
7 tet g a + iNet Asset Hy + 285.5 233.6 = 192.5 243.0 239.2 198.8 Pp 257.8 199.4 + 2940.7
ve of Property at ' 925.0 + 925.0 |
a95a z2 + iNew Stores Under Const'n H + 1258.0 1797.5 750.0 «3038.0 «10740 10.4 699.0 99,0 1 ¢
a sot Cc + of Interest | + 92.4 103.2 65.3 Pa 68.9 118, 34.2 38.7 -317.6 + 989.7 |
g @ tDeoreciationr 1 225,58 -244,7 86.3 -286.3 -266.2 + |
a | Carried Forward+79709.2 + 82998.3 B3502.7 84324.3 87446.4 8B539,5 90649.0 95952.2 -317.6 | 94483.2 |
ga 3 @ H ASSETS : : H
1 49925.6 | 50B52,2 5182.4 54497. S4951,4
5 a 'SHARE & | | |
CAPITAL
ga H RESERVES+20326.9 20326.9 20326.9 20326.9 20326.9 20726.9 20326.9 2052.9 20326.9 20326.9 + 20325.9 |
H H
i 36 + Profit & Loss Account
< i iBalance at Start of Period|32262.6 33049.2 34170.2 38239.9 36524.5 4 1 29598.7
oO rh {Profit on Trading Hy + 993.4 A |
+f 1 + 1197.2 1208.4 1212.6 1153.2 1395.4 1264.0 Yet 1138.0 02.6 1568.3 + 16607.4
Oo tProfit on Sale of Property!175.0 175.0!
Oo Oo ° | tTakeover Defence Costs'7300.0 | =
o3 Profit Share : + 7668 73.1 90.8 82,9 + 71255.0 :
Paid H H ! x}tpueddy
n= | {Dividends Payable H t + 7644.5 ¢
a fo) Dividend ' 1 -791.9
@ 1 | -5377.0 5
ed !
5 gq | Closing Balance+29598.7 30525.3 32262.6 33049.2 34170,2 35239.9 36524.5 37705.6 39103.1 39004,8 41598.0 36431.9 -317.6 | 3114.3 3
i H : III
'TOTAL SHAREHOLDERS FUNDS+49925.6 50B52.2 51828.4 52589.5 53376.1 54497.1 $5566.8 5¢951.4 58032.5 59430.0 $9531.7 60640.6 62024.9 -317.6 56441.2
H
_ - a ae eeRead by machine, contrast corrected
 \
 °  HILLARDS  ple  @
 TALL  FIGURES   IN  £'000  H  THE  30  ' FORECASTS FOR YEAR ENDING APRIL 1988
 1"  =   °  ©  liability,  cost,  loss   or  payaent BALANCE SHEETS OVER ACCOUNTING PERIQDS:-
 \  2  3  4  5  6  7  8  9  10  12  13  YEAR
 '  END  +  30  MAY  JUN)  AUG  SEP  OCT  DEC  JAN  FEB  SHAR  APR  APR  END  ‘BAL  SHEET: «25 JUL) «22 «19 17 12 9 6 2 30
 12  HAY  ‘87  87  ‘87  ‘87  "87  87  ‘87  “BB  "88  88  “88  BB  ADJUST  $30  APR   8B:
 @  LIABILITIES  :
 |  ACT Pavable  “428.8  -428.8  -428.8  -866.5  +
 |  Dividends  1  ¢  -1370.4  -1370.4  -1370.4  +
 ¢  3  H  Corp.  Tax   Due  - Jan  ‘88  1  -526.5  -526.5  :
 - Feb  ‘8B  ¢  -1881.1  -1881.1  BB  -1881.1  ‘
 fe)  H  - Jan  =900.0  -900.0  -900.0  -900.0  -900.0  -900.0  -900.0  -900.0  -900.0  -900.0
 no  !  ~ Fob  ‘89  |  |  2904.5  1
 aes?  &  =1100,0  1  1100.0 !
 os  n  |  Eap.   Prof.   Share  -y/e  Hay  ‘87!  -659.8  -659.8  -659.8  -659.8  -339.8  :  ;
 4  o  H  May  ‘BB!  1  966.8  -B899.5  -1009.2  -1127.5  -1255.0  1
 °  =.  5  @  Creditors  1-31238.9  -32957.4  -33731.6  -32601.2  -36083.0  2506.3  -41763,2  -39168.0  -37784.7   -38244.5  -38119.6  |
 5  +  Accruals  (Inc.  Cap.  Leases)  |  -3850.0  |  -4500.0  -4316.2  -4167.4  .  4815.1  +
 te  ga  +  Bank  Overdraft  1  1  -2456.8  -1935.1  -2456.5  3352.6  -3341.3  -4085.3  -3575.1  -3643.0  1  |
 !  tag  Inn  H
 °  8  :  -45952.8  -45824.5  -49826.8   -49387.4  -55245.0  |
 3  4  ASSETS  nn  Lae  '
 ae’  ct  Stock  of   Goods  1  17492.0  16647.4  19696.7  20101.9  20547.0  20839.8  +  20839.8  |
 o  Stock  of   Sundries  +  163.0:  164.0  168.0  165.0  165.0  165.0  165.9  165.6  165.0  +  165.01
 3  |  Debtors  &   Prepayaents  +  2000.0  |  2300.0  3200.0  3400.0  3300.0  3200.0  3400.0  2800.0  2600.0  2500.0  +  2506.0  ¢
 re)  ac  |  Short  Deoosits  '  H  :
 :  >  Cash   in  Hand/at  Bank  +  $45.0)  545.0  565.0  =   60.0  60.0  =  540.0  570.0  590.0  590.0  590.0  +  $90.0!
 @  ¢  =}  o  ACT  Recoverable  t  506.9  +  506.9  = 506.9  =  806.9  =  628.3  629.5  1055.1  1058.1  608.2  +  608.2 =
 ©  ¢  =  :  +  20706.9  |  20363.2  20782.9  20179.  24715.0  +  24793.9
 30  o
 g  5  ©  INET  CURRENT  '-24237.4  -28169,9  -24013,2  -26472,7  :  A  |
 Cc  |  Mortoage  Loan  1  1  -6000.0  -6000.%  -5000.%  -6500.0  -6804.0  so  -956u.5  -9500.%  + q
 » 8  n  Faxed Assets
 ke  oO  ct  wo  +  at   start  of  period  =|  1  79709,2  G1089.5  83502.7?  87446,4  94024.2  9825204  95952.  +  79709.2 BES
7  tet  g  a  +  iNet  Asset  Hy  +  285.5  233.6  =  192.5  243.0  239.2  198.8  Pp  257.8  199.4  +  2940.7
 ve  of  Property  at  '  925.0  +  925.0  |
a  9  5  a  z2  +  iNew   Stores  Under  Const'n  H  +  1258.0  1797.5  750.0  «3038.0  «10740  10.4  699.0  99,0  1  ¢
a  sot  Cc  +  of  Interest  |  +  92.4  103.2  65.3  Pa  68.9  118,  34.2  38.7  -317.6 +  989.7  |
 g  @  tDeoreciationr  1  225,58  -244,7  86.3  -286.3  -266.2  +  |
 a  |  Carried  Forward  +  79709.2  +  82998.3  B3502.7  84324.3  87446.4  8B539,5   90649.0  95952.2  -317.6 |  94483.2  |
 ga  3  @  H  ASSETS  :  :  H
 1  49925.6  |  50B52,2  5182.4  54497.  S4951,4
 5  a  ‘SHARE  &  |  | |
 CAPITAL
 ga  H  RESERVES  +  20326.9  20326.9  20326.9  20326.9  20326.9  20726.9  20326.9  2052.9  20326.9  20326.9  +  20325.9  |
 H  H
i  36  +  Profit &  Loss  Account
 <  i  iBalance  at Start  of  Period  |  32262.6  33049.2  34170.2  38239.9  36524.5  4  1  29598.7
 oO  rh  {Profit  on   Trading  Hy  +  993.4  A  |
 +f  1  +  1197.2  1208.4  1212.6  1153.2  1395.4  1264.0  Yet  1138.0  02.6  1568.3  +  16607.4
 Oo  tProfit  on   Sale  of  Property  !  175.0  175.0!
 Oo  Oo  °  |  tTakeover  Defence  Costs  '  7300.0  | =
 o3  Profit  Share  :  +  7668  73.1  90.8  82,9  +  71255.0  :
 Paid  H  H  ! x}tpueddy
 n=  |  {Dividends  Payable  H  t  +  7644.5  ¢
 a  fo)  Dividend  '  1  -791.9
 @  1  |  -5377.0  5
 ed  !
 5  gq  |  Closing  Balance  +  29598.7  30525.3  32262.6  33049.2  34170,2  35239.9  36524.5  37705.6  39103.1  39004,8  41598.0  36431.9  -317.6  |  3114.3  3
 i  H  : III
 ‘TOTAL  SHAREHOLDERS  FUNDS  +  49925.6  50B52.2  51828.4  52589.5  53376.1  54497.1  $5566.8  5¢951.4  58032.5  59430.0  $9531.7  60640.6  62024.9  -317.6  56441.2
 H


                                                      _                                                          —                                                                                              a                                ae ee
\
° HILLARDS ple @
TALL FIGURES IN £'000 H THE 30 ' FORECASTS FOR YEAR ENDING APRIL1988
1" = ° © liability, cost, loss or payaent BALANCE SHEETS OVER ACCOUNTING PERIQDS:-
\ 23456789 10 12 13 YEAR
' END + 30 MAY JUN) AUG SEP OCT DEC JAN FEB SHAR APR APR END 'BAL SHEET:«25 JUL) «22 «19 17 12 962 30
12 HAY '87 87 '87 '87 "87 87 '87 "BB "88 88 "88 BB ADJUST$30 APR 8B:
@ LIABILITIES :
| ACT Pavable "428.8 -428.8 -428.8 -866.5 +
| Dividends 1 ¢ -1370.4 -1370.4 -1370.4 +
¢ 3 H Corp. Tax Due - Jan '88 1 -526.5 -526.5 :
- Feb '8B ¢ -1881.1 -1881.1 BB -1881.1 '
fe) H - Jan =900.0 -900.0 -900.0 -900.0 -900.0 -900.0 -900.0 -900.0 -900.0 -900.0
no ! ~ Fob '89 | | 2904.5 1
aes? & =1100,0 1 1100.0 !
os n | Eap. Prof. Share -y/e Hay '87! -659.8 -659.8 -659.8 -659.8 -339.8 : ;
4oH May 'BB! 1 966.8 -B899.5 -1009.2 -1127.5 -1255.0 1
° =. 5 @Creditors1-31238.9 -32957.4 -33731.6 -32601.2 -36083.0 2506.3 -41763,2 -39168.0 -37784.7 -38244.5 -38119.6 |
5 + Accruals (Inc. Cap. Leases)|-3850.0 | -4500.0 -4316.2 -4167.4 . 4815.1 +
te ga + Bank Overdraft 1 1 -2456.8 -1935.1 -2456.5 3352.6 -3341.3 -4085.3 -3575.1 -3643.0 1 |
! tag Inn H
° 8 : -45952.8 -45824.5 -49826.8 -49387.4 -55245.0 |
3 4 ASSETS nn Lae '
ae' ct Stock of Goods117492.0 16647.4 19696.7 20101.9 20547.0 20839.8 + 20839.8 |
o Stock of Sundries+163.0: 164.0 168.0 165.0 165.0 165.0 165.9 165.6 165.0 + 165.01
3 | Debtors & Prepayaents + 2000.0 | 2300.0 3200.0 3400.0 3300.0 3200.0 3400.0 2800.0 2600.0 2500.0 + 2506.0 ¢
re) ac | Short Deoosits ' H :
: > Cash in Hand/at Bank+$45.0) 545.0 565.0 = 60.0 60.0 = 540.0 570.0 590.0 590.0 590.0 + $90.0!
@ ¢ =} o ACT Recoverable t 506.9 + 506.9 = 506.9 = 806.9 = 628.3 629.5 1055.1 1058.1 608.2 + 608.2 =
© ¢ = : + 20706.9 | 20363.2 20782.9 20179. 24715.0 + 24793.9
30 o
g 5 © INET CURRENT'-24237.4-28169,9 -24013,2 -26472,7 : A |
Cc | Mortoage Loan 1 1 -6000.0 -6000.% -5000.% -6500.0 -6804.0 so -956u.5 -9500.% + q
» 8 n Faxed Assets
ke oO ct wo + at start of period =| 1 79709,2 G1089.5 83502.7? 87446,4 94024.2 9825204 95952. + 79709.2 BES
7 tet g a + iNet Asset Hy + 285.5 233.6 = 192.5 243.0 239.2 198.8 Pp 257.8 199.4 + 2940.7
ve of Property at ' 925.0 + 925.0 |
a95a z2 + iNew Stores Under Const'n H + 1258.0 1797.5 750.0 «3038.0 «10740 10.4 699.0 99,0 1 ¢
a sot Cc + of Interest | + 92.4 103.2 65.3 Pa 68.9 118, 34.2 38.7 -317.6 + 989.7 |
g @ tDeoreciationr 1 225,58 -244,7 86.3 -286.3 -266.2 + |
a | Carried Forward+79709.2 + 82998.3 B3502.7 84324.3 87446.4 8B539,5 90649.0 95952.2 -317.6 | 94483.2 |
ga 3 @ H ASSETS : : H
1 49925.6 | 50B52,2 5182.4 54497. S4951,4
5 a 'SHARE & | | |
CAPITAL
ga H RESERVES+20326.9 20326.9 20326.9 20326.9 20326.9 20726.9 20326.9 2052.9 20326.9 20326.9 + 20325.9 |
H H
i 36 + Profit & Loss Account
< i iBalance at Start of Period|32262.6 33049.2 34170.2 38239.9 36524.5 4 1 29598.7
oO rh {Profit on Trading Hy + 993.4 A |
+f 1 + 1197.2 1208.4 1212.6 1153.2 1395.4 1264.0 Yet 1138.0 02.6 1568.3 + 16607.4
Oo tProfit on Sale of Property!175.0 175.0!
Oo Oo ° | tTakeover Defence Costs'7300.0 | =
o3 Profit Share : + 7668 73.1 90.8 82,9 + 71255.0 :
Paid H H ! x}tpueddy
n= | {Dividends Payable H t + 7644.5 ¢
a fo) Dividend ' 1 -791.9
@ 1 | -5377.0 5
ed !
5 gq | Closing Balance+29598.7 30525.3 32262.6 33049.2 34170,2 35239.9 36524.5 37705.6 39103.1 39004,8 41598.0 36431.9 -317.6 | 3114.3 3
i H : III
'TOTAL SHAREHOLDERS FUNDS+49925.6 50B52.2 51828.4 52589.5 53376.1 54497.1 $5566.8 5¢951.4 58032.5 59430.0 $9531.7 60640.6 62024.9 -317.6 56441.2
H
_ - a ae ee