Below is what the machine read from this scan, three times over. They are kept separate rather than merged: where they disagree, the disagreement is itself worth seeing, and a single tidy transcription would hide it.
The left column is raw output. The right is the same text after the repairs that make it searchable — joining letter-spaced words, mending split ones.
Text already in the scan
    5?     0?
    S      0 6


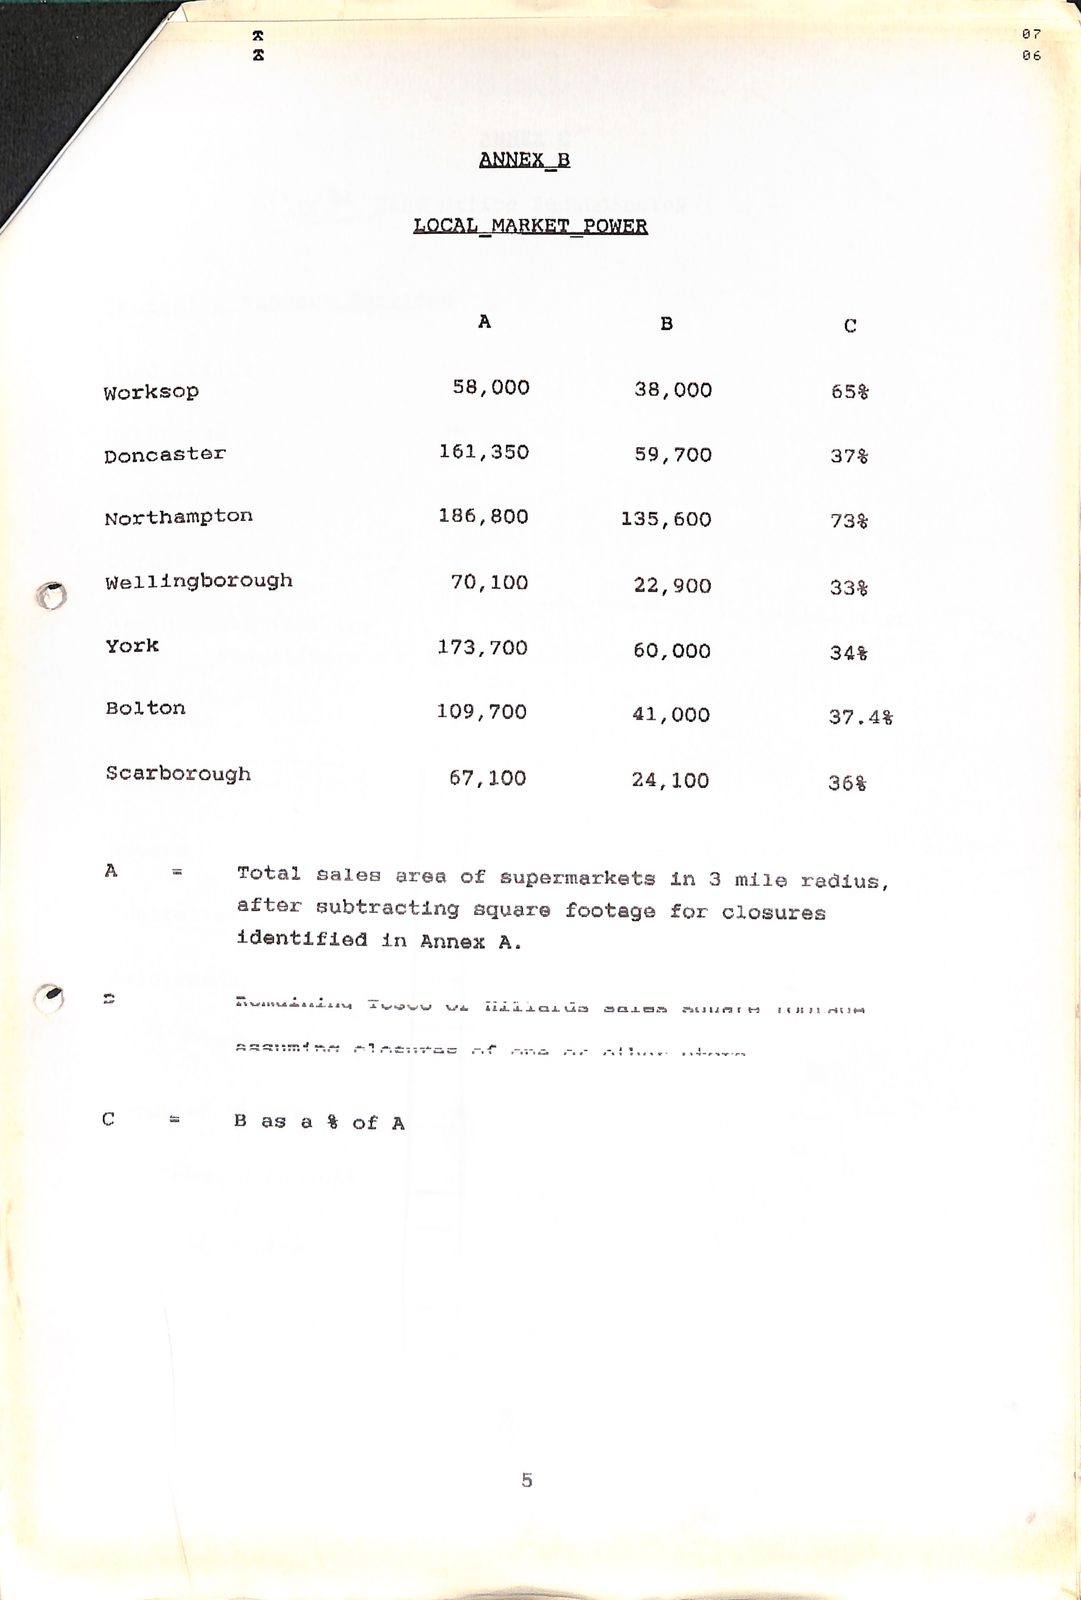
    LOCAL_MARKET_POWKR


    B    C


    W o r k s o p                    5 8,0 0 0     3 8,0 0 0         6 5%

    D o n c a s t e r              1 6 1,3 5 0     5 9,7 0 0         3 7%

    N o r t h a m p t o n          1 8 6,8 0 0       1 3 5,6 0 0     7 3%

    W e l l i n g b o r o u g h      7 0,1 0 0     2 2,9 0 0         33%

    Y o r k                        1 7 3,7 0 0     6 0,0 0 0         3 4%

    B o l t o n                    1 0 9,7 0 0     4 1,0 0 0         3 7 .4%

    Sc a r bo ro ug h                6 7,1 0 0     2 4,1 0 0         3 6%


Total sales area of supermarkets In 3 mil© radius,
    after  subtracting             square footage  for closures
    i d e n t i fi e d i n A n n e x A .


                                   A £ 3 a C 3 .   J. e s A A i J l i n r  I I J I J X  r i  \


    B a s a % o f A


                                   5
5? 0? S06 LOCAL_MARKET_POWKR B C Worksop5 8,0 003 8,0 006 5% Doncaster161,3505 9,7 003 7% Northampton186,80013 5,6 007 3% Wellingborough7 0,1 002 2,9 0 0 33% York173,7006 0,0 003 4% Bolton109,7004 1,0 0037 .4% Sc a r bo ro ug h 6 7,1 002 4,1 003 6% Total sales area of supermarkets In 3 mil© radius, after subtracting square footage for closures identi fi edinAnnexA . A£3aC3 . J. esAAiJlinrIIJIJXri \ Basa % ofA 5
Read by machine highest quality of the three
    D3
    ba


    A    B    C


    Worksop           58,000          38,000    65%

    Doncaster         161,350         59,700    37%

    Northampton       186,800        135,600    73%

    Wellingborough     70,100         22,900    33%

    York                         60,000         34%

    Bolton            109,700     41,000        37.4%

    Scarborough        67,100     24,100        36%


A = Total sales area of Supermarkets in 3 mile radius,
        after subtracting square footage for closures
        identified in Annex A.


    Cc  = Bas
D3 ba ABC Worksop 58,000 38,000 65% Doncaster161,35059,700 37% Northampton186,800135,600 73% Wellingborough 70,100 22,900 33% York60,00034% Bolton109,70041,000 37.4% Scarborough67,10024,100 36% A = Total sales area of Supermarkets in 3 mile radius, after subtracting square footage for closures identified in Annex A. Cc = Bas
Read by machine, contrast corrected
    D3
    ba


    A    B    C


    Worksop           58,000          38,000    65%

    Doncaster         161,350         59,700    37%

    Northampton       186,800        135,600    73%

    Wellingborough     70,100         22,900    33%

    York              173,700     60,000        34%

    Bolton            109,700     41,000        37.4%

    Scarborough        67,100     24,100        36%


A = Total sales area of Supermarkets in 3 mile radius,
        after subtracting square footage for closures
        identified in Annex A.


    Cc  = Bas a&ofaA
D3 ba ABC Worksop 58,000 38,000 65% Doncaster161,35059,700 37% Northampton186,800135,600 73% Wellingborough 70,100 22,900 33% York173,70060,000 34% Bolton109,70041,000 37.4% Scarborough67,10024,100 36% A = Total sales area of Supermarkets in 3 mile radius, after subtracting square footage for closures identified in Annex A. Cc = Bas a&ofaA