Hillards Growing Not Going Report page 9 of 28 previous next
Below is what the machine read from this scan, three times over. They are kept separate rather than merged: where they disagree, the disagreement is itself worth seeing, and a single tidy transcription would hide it.
The left column is raw output. The right is the same text after the repairs that make it searchable — joining letter-spaced words, mending split ones.
Text already in the scan
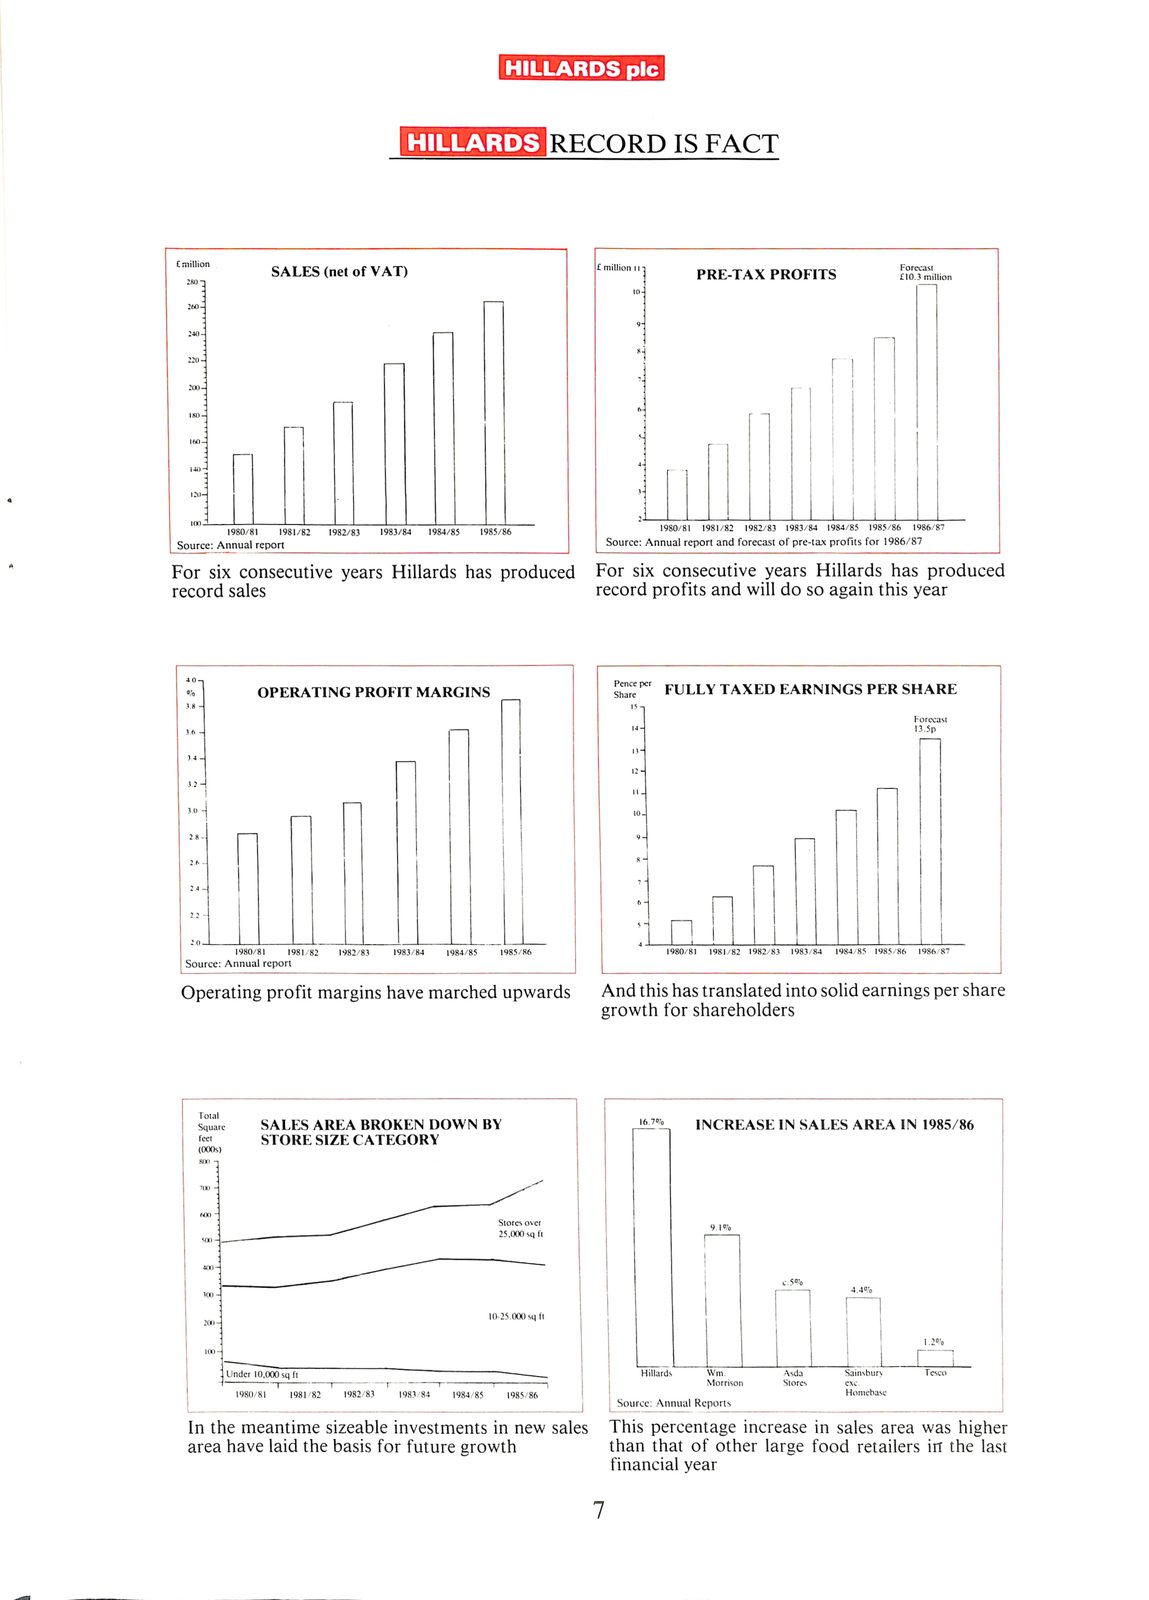
    H I L L A R D S R E C O R D I S F A C T


C m i l l i o n    S A L E S (n e t o f VAT )               F o r c c a s i
       ;f U 3 n        P R E - T A X      P R O F I T S     £ 10.3 m i l l i o n


    I


        1 9 8 0 / 8 1 1 9 8 1 / 8 2 1 9 8 2 / 8 3 1 9 8 3 / 8 4 1 9 8 4 / 8 5  1 9 8 5 / 8 6              19 8 0 / 81  19 8 1/8 2  19 8 2 / 8 3  19 8 3 / 8 4  19 8 4 / 8 5  19 8 5 / 86  19 8 6 / 87
    Source: Annual report        Source:     Annual                                                           report   and     forecast of     pre-tax     profits        for  1986/87

    For six consecutive     years                                    Hillards has produced     For six    consecutive                  years                        Flillards  has     produced
    r e c o r d    s a l e s     r e c o r d                             p r o fi t s     a n d w i l l   d o     s o                a g a i n                        t h i s  y e a r


  Pence  per
  O P E R A T I N G  P R O F I T  M A R G I N S  S h a r e  F U L L Y  T A X E D  E A R N I N G S  P E R  S H A R E

  h o r c c a M
  I3.5p


                                                                                                          n


    19 8 0 / 81     19 8 1,8 2  19 8 2 / 8 3    19 8 3 / 8 4    19 8 4 / 8 5                              19 8 0 / 81 I9 8 1,'8 2 19 8 2,8 3 19 8 3 / 8 4 19 8 4 / 8 5 19 8 5 -8 6 19 8 6 8 7
    Source: Annual  report

    Operating       profit margins                      have       marched     upwards And this           has translated     into     solid                             earnings   per     share
                        growth                                                                            for shareholders


    S A L E S  A R E A B R O K E N D O W N B Y                                                            '1, INCREASE IN SALES AREA IN                                        1985/86
    S T O R E  S I Z E C A T E G O R Y


                                                                                                                  W m .             •\s d a      S a i n s b n r s   f         e s c o
                                                                                                                  M o r r i s o n   S t o r e s  e.s c
                    1 9 8 1 8 2 1 9 8 2 8 3 1 9 8 3 8 4 1 9 8 4 8 5                                                                     H o n i c h a s c
                                                          Source:                                         .Annual Reports

    In the meantime sizeable                            investments    in new sales This                     percentage  increase       in     sales  area           was higher
    area have  laid     the     basis     for     future     growth     than that                         of      other     large     food     retailers             in        the last
                        financial                                                                             year

                        7
HILLARDSRECORDISFACT CmillionSALES (n etof VAT ) Forccasi ;f U3nPRE - TAXPROFITS£ 10.3million I 1980 / 811981 / 821982 / 831983 / 841984 / 851985 / 8 6 19 8 0 / 81 19 8 1/8 2 19 8 2 / 8 3 19 8 3 / 8 4 19 8 4 / 8 5 19 8 5 / 86 19 8 6 / 87 Source: Annual report Source: Annual report and forecast of pre-tax profits for 1986/87 For six consecutive years Hillards has produced For six consecutive years Flillards has produced recordsalesrecordpro fi tsandwilldosoagainthisyear Pence per OPERATINGPROFITMARGINSShareFULLYTAXEDEARNINGSPERSHARE horccaM I3.5p n 19 8 0 / 81 19 8 1,8 2 19 8 2 / 8 3 19 8 3 / 8 4 19 8 4 / 8 5 19 8 0 / 81 I9 8 1,'8 2 19 8 2,8 3 19 8 3 / 8 4 19 8 4 / 8 5 19 8 5 -8 6 19 8687 Source: Annual report Operating profit margins have marched upwards And this has translated into solid earnings per share growth for shareholders SALESAREABROKENDOWNBY '1,INCREASE IN SALES AREA IN 1985/86 STORESIZECATEGORY W m . •\s daSainsbnrsfesco MorrisonStores e.s c 198182198283198384198485Honichasc Source: .Annual Reports In the meantime sizeable investments in new sales This percentage increase in sales area was higher area have laid the basis for future growth than that of other large food retailers in the last financial year 7
Read by machine
  RECORD IS FACT


  SALES (net of VAT)    mont     Forecas
      PRE-TAX     PROFITS        £103 million
                          10


                                                              j                                                f    |     |
    2004                                                                                                       }    |     4     |
                                                                                                    |               |     |
    1804                                                      ‘                                           |         |     |     |          |
       j        |                                                                                   |     |               tf               |
                                                                  ]   [| |  |                                       ;     |     |          |
                                                                                                          |                     |
                                                                                                          |                     }
     103    1980/81                                           aL     1980/81    |                         Lit             it         |     |
        1981/82      1982/83  1983/84  1984/85  1985/86           1981/82      1982/83 1983/84                 1984/85   1985/86     1986/87
  | Source: Annual report                                     Source: Annual report and forecast of pre-tax profits for        1986/87
  For six   consecutive     years Hillards     has produced   For six consecutive    years                     Hillards            has produced
  record sales                                                record profits and will do                so     again this            year


  40
    OPERATING PROFIT MARGINS                                      FULLY TAXED EARNINGS PER SHARE
                                                                |

                                                                      13.5p
                                                              144     Forecast


10-4  al
|  |
ed  |  |
|
;  |
|  |
6  |  |
|  |
\  |  |
|
|  |  |
|  |
4  mt  i  |  |
1980/81  1981/82  1982/83  1983/84  1984/85  1985/86  1980/81  1981/82   1982/83  1983/84  1984/85  1985/86  1986/87  |
Source: Annual report

Operating profit margins have marched upwards  And this has translated into solid earnings  per  share
growth for shareholders


[  roa  |
|  |
SALES AREA BROKEN DOWN BY  16.7% =   INCREASE IN SALES AREA IN 1985/86  |
|  STORE SIZE CATEGORY  |  |
|  800
|
|  700  4  _  |
|  |
|  nd  25,000  sq  ft  |  |  ae
|
|
|
|  a  |  |
|  |  |  |
|  10-25.000  sq  ft  |  |  |  |  |
|?  wd  |  |  |  |  |
|
;
1004  |  |  |  |  |
|  |  |  |  J  L  L
|  Hillards  1
Under  10,000 sq ft  |  Wm.  Asda  Sainsbury  Tesco
|  —  —  _ra  |  |  Morrison  tores  exe
1980/81  1981/82  83  1983  1984/85  1985/86  Homebase
J  | Source: Annual Reports
In the meantime sizeable investments in  new  sales  This  percentage increase  in sales  area was   higher
area  have laid the basis for future growth  than that of other  large  food retailers  im   the last
financial year

7
RECORD IS FACT SALES (net of VAT) mont Forecas PRE-TAX PROFITS£103 million 10 j f | | 2004 } | 4 | | | | 1804 ' | | | | | j | | | tf | ] [| | | ; | | | | | | } 103 1980/81 aL 1980/81 | Lit it | | 1981/82 1982/83 1983/84 1984/85 1985/86 1981/82 1982/83 1983/84 1984/85 1985/86 1986/87 | Source: Annual report Source: Annual report and forecast of pre-tax profits for 1986/87 For six consecutive years Hillards has produced For six consecutive years Hillards has produced record sales record profits and will do so again this year 40 OPERATING PROFIT MARGINS FULLY TAXED EARNINGS PER SHARE | 13.5p 144Forecast 10-4 al | | ed | | | ; | | | 6 | | | | \ | | | | | | | | 4 mt i | | 1980/81 1981/82 1982/83 1983/84 1984/85 1985/86 1980/81 1981/82 1982/83 1983/84 1984/85 1985/86 1986/87 | Source: Annual report Operating profit margins have marched upwards And this has translated into solid earnings per share growth for shareholders [ roa | | | SALES AREA BROKEN DOWN BY 16.7%=INCREASE IN SALES AREA IN 1985/86 | | STORE SIZE CATEGORY | | | 800 | | 700 4 _ | | | | nd 25,000 sq ft | | ae | | | | a | | | | | | | 10-25.000 sq ft | | | | | |? wd | | | | | | ; 1004 | | | | | | | | | JLL | Hillards 1 Under10,000 sq ft | Wm. Asda Sainsbury Tesco | - - _ra | | Morrison tores exe 1980/81 1981/82 83 1983 1984/85 1985/86 Homebase J | Source: Annual Reports In the meantime sizeable investments in new sales This percentage increase in sales area was higher area have laid the basis for future growth than that of other large food retailers im the last financial year 7
Read by machine, contrast corrected highest quality of the three
    RECORD IS FACT


    SALES (net of VAT)     Forecast
        PRE-TAX PROFITS    £10.3 million
        104


               ry|
                |   |
    64       |  |
        |    |  |   |
                    |
        5       |   |
                |


    1980/81      1981/82  1982/83    1984/85  1985/86    1980/81  1981/82  1982/83 1983/84 1984/85 1985/86  1986/87
    Source: Annual report                                Source: Annual report and forecast of pre-tax profits for 1986/87
For six consecutive years Hillards has produced For six consecutive years Hillards has produced
    record sales                                         record profits and will do     so     again this     year


    40   |                                               cence Pe!
    we        OPERATING PROFIT MARGINS                       FULLY TAXED EARNINGS PER SHARE
    38-4

                                                                  13.5p
                                                         134      Forecast


   ja

   324    H                                                   |
          |
    04                                                        |

   28-

   26-                                                                   41 |                                                       |
                                                                         TE |      1                                                |
   20                                                                    i
              1980/81  1981/82  1982/83  1983/84  1984/85     1985/86    1980/81  1981/82 1982/83  1983/84  1984/8S 1985/86  1986/87
    Source:    Annual report

    Operating profit margins have marched upwards                        And this has translated into solid earnings     per     share
                                                                         growth for shareholders


  SALES AREA BROKEN DOWN BY  INCREASE IN SALES AREA IN 1985/86  |
  ti  STORE SIZE CATEGORY  |
  800 7  |
  a  |
  700 4  |

  07
  Stores  over  |  9.1%
  soo 4  25,000  sq  ft  |  |
  |
  |
  |  wo  +  |  |  |  |
  |  10-25.000  sq  ft  |  |  |
  2004  |  ;  |  |  |  |
  |  100  4  |  |  |  es
  |  |  |
  |  Under 10,000  sq ft  |  |  Hillards  Wm.  Avda  Sainsbury  Tesco
  1  1980/81  1981/82  1982/83  1983/84  1984/85  1985/86  |  |  ||   Source: Annual  Morrison  Stores  |
  |  Reports
  —
  In the meantime sizeable investments in  new  sales  This  percentage  increase  in sales  area  was  higher
  area  have laid the basis for future growth  than that  of other  large  food retailers  im   the last
  financial  year
RECORD IS FACT SALES (net of VAT) Forecast PRE-TAX PROFITS£10.3 million 104 ry| | | 64 | | | | | | | 5 | | | 1980/81 1981/82 1982/83 1984/85 1985/86 1980/81 1981/82 1982/83 1983/84 1984/85 1985/86 1986/87 Source: Annual report Source: Annual report and forecast of pre-tax profits for 1986/87 For six consecutive years Hillards has produced For six consecutive years Hillards has produced record sales record profits and will do so again this year 40 | cence Pe! we OPERATING PROFIT MARGINS FULLY TAXED EARNINGS PER SHARE 38-4 13.5p 134Forecast ja 324 H | | 04 | 28- 26- 41 | | TE | 1 | 20 i 1980/81 1981/82 1982/83 1983/84 1984/85 1985/86 1980/81 1981/82 1982/83 1983/84 1984/8S 1985/86 1986/87 Source: Annual report Operating profit margins have marched upwards And this has translated into solid earnings per share growth for shareholders SALES AREA BROKEN DOWN BY INCREASE IN SALES AREA IN 1985/86 | ti STORE SIZE CATEGORY | 800 7 | a | 700 4 | 07 Stores over|9.1% soo 4 25,000 sq ft | | | | | wo + | | | | | 10-25.000 sq ft | | | 2004 | ; | | | | | 100 4 | | | es | | | |Under10,000 sq ft | | Hillards Wm. Avda Sainsbury Tesco 1 1980/81 1981/82 1982/83 1983/84 1984/85 1985/86 | | || Source: Annual Morrison Stores | | Reports - In the meantime sizeable investments in new sales This percentage increase in sales area was higher area have laid the basis for future growth than that of other large food retailers im the last financial year